
The given Pie-Chart shows the degree-wise breakup of expenditure of a family in a month. The Total income of a family is Rs.43,200. Expenditure on food is what percent more than expenditure on rent?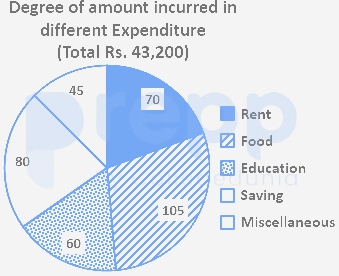
50%
Calculation:
Expenditure on food = 105
Expenditure on rent = 70
Required percentage = [(105 – 70)/70 × 100]
⇒ (35/70 × 100)
⇒ 50%
∴ The required percentage is 50%
Similar Questions
The breakup of the total number of employees of a company working in different offices (A to E), in degrees, is given in the pie chart.
Total number of employees = 2400.
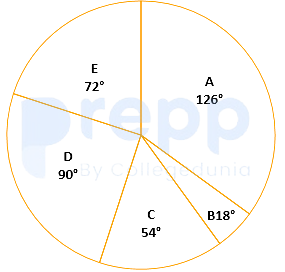
In which office is the number of employees 600?
Pie-Chart shows the degree wise breakup of expenditure of a family in a month. Total income of the family is Rs. 144000.
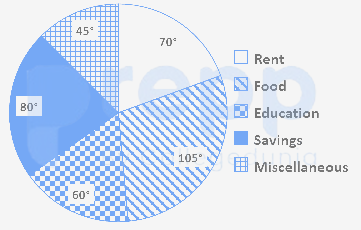
What is the expenditure (in Rs.) on education?
The following Pie charts represent the distribution of candidates who were enrolled for competitive examination and the candidates (out of those enrolled) who passed the exam from five different institutes P, Q, R, S and T.
Fig. Total number of candidates enrolled in five different institutes = 7500
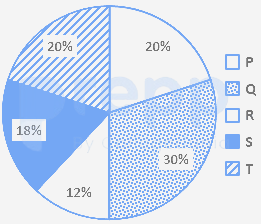
Fig. Total number of candidates passed the examination from five institutes = 4000
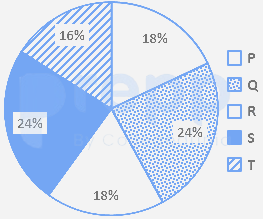
What is the pass percentage for institute Q? (correct up to one decimal place.)
The following pie charts represent the distribution of candidates who were enrolled for a competitive examination, and the candidates (out of those enrolled) who passed the exam from five different institutes P,Q, R, S and T.
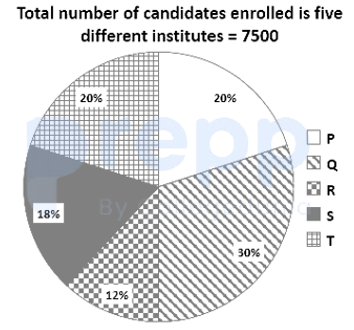
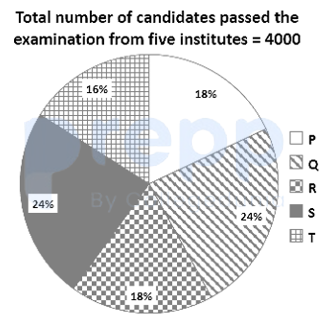
What is the ratio of the total number of candidates enrolled in institutes Q, R and S together, to the number of candidates passed from the institutes Q, R and S together?
Study the given pie charts and answer the question that follows.
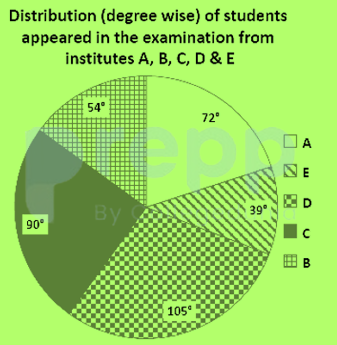
Total Number of Students appeared = 1200
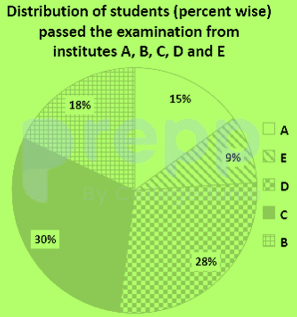
Total Number of Students passed = 900
The number of students who passed the examination from institute C is what percentage of the total number of students who appeared from institutes D and E?
What is the total monthly income of the family?
What percent of the total income does the family save?
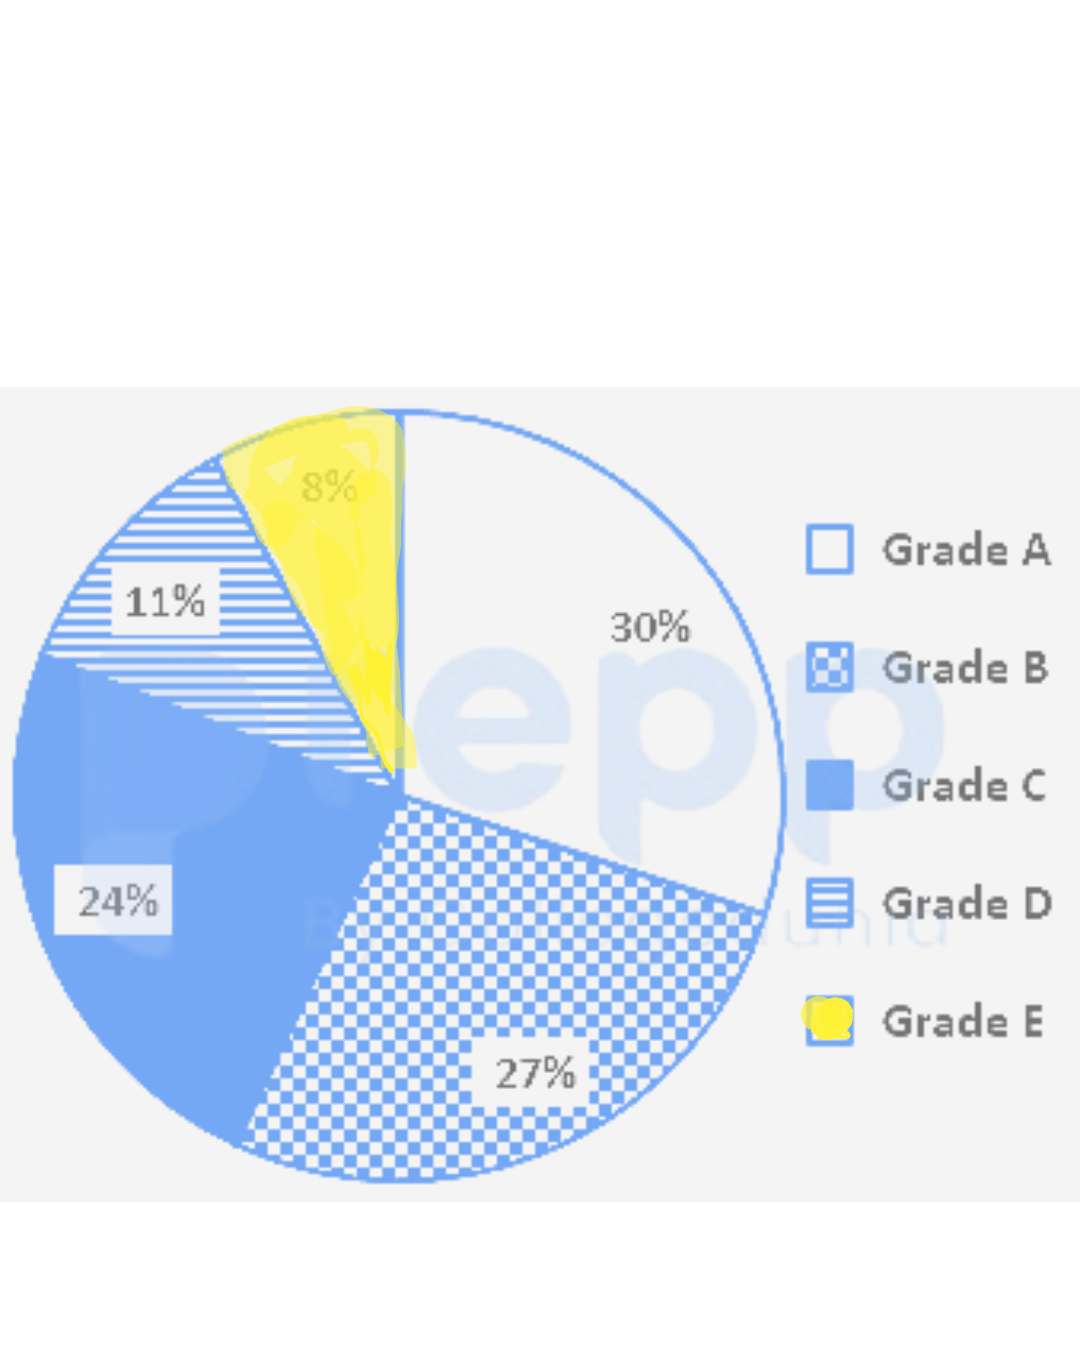
Performance of 1800 students in grades has been shown in the following pie chart.
In which two grades taken together is the number of students 54 less than the number of students in grades B and E taken together?
Airline E sold how many more percentage of tickets than Airline A?
Which airline sold the second highest number of tickets?
Important Questions from Pie Chart
Study the following pie-charts carefully to answer the questions.
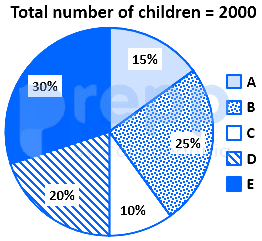
If 70 percent children from village D go to school then what is the number of children attending school from village D ?
Study the following pie-charts carefully to answer the questions.Percentage break-up of number of children in five different villages
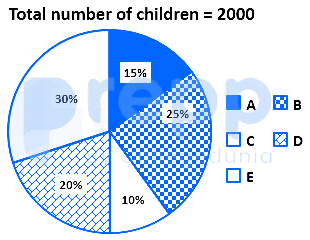
What is the respective ratio of total number of children from village A to village C ?
Study the following pie-charts carefully to answer the questions.Percentage break-up of number of children in five different villages
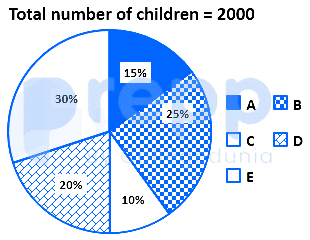
What is the total number of children in villages B and E ?
Study the chart and answer the question based, on the pie chart.The pie chart is given below shows expenditures incurred by a family on various items and savings in a month. Savings of the family is ₹ 8,000 in a month.
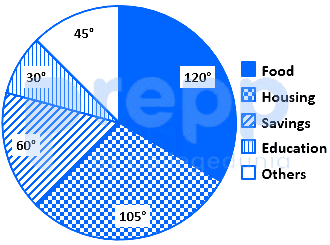
What is the total expenditure of the family for the month?
Study the chart and answer the question based, on the pie chart.The pie chart given below shows expenditures incurred by a family on various items and savings in a month. Savings of the family is ₹ 8,000 in a month.
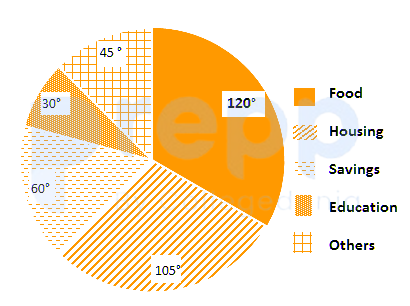
How much more amount is spent on food than on housing?



