
The following three panels show the change in population size over time for two species when they are found alone and when they are found together. Which kind of interaction best describes the relationship between the two species? 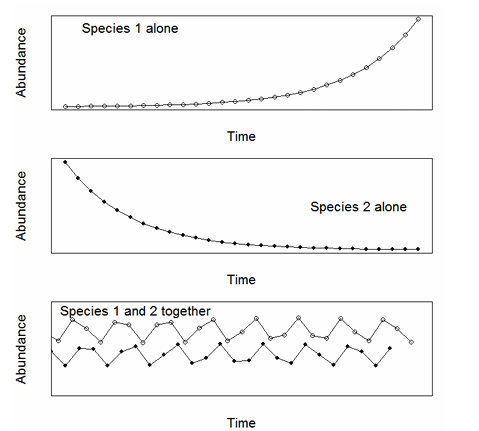
To determine the interaction between the two species, we need to analyze the population trends depicted in the graphs:
- When Species 1 is alone, its population grows over time, indicating a stable or favorable environment for its growth.
- When Species 2 is alone, its population decreases, suggesting that it may not thrive as well on its own or that it may be inherently less competitive.
- When Species 1 and Species 2 are together, the population of Species 1 shows fluctuations, and the population of Species 2 also fluctuates but with lower peaks.
The key observations are:
- Species 1 thrives when alone but shows fluctuating populations when in the presence of Species 2.
- Species 2 struggles alone and shows population decreases even when together with Species 1.
This pattern aligns with the phenomenon of predation. In a predator-prey relationship, the predator’s population tends to grow when its prey is abundant. Conversely, the prey’s population decreases as it is consumed.
The given options include:
- Amensalism: One species is harmed, and the other is unaffected. This does not fit because both species are affected when together.
- Competition: Both species are harmed by sharing resources. This is not evident since one species thrives in the presence of the other.
- Mutualism: Both species benefit. This is not applicable as Species 2’s population decreases.
- Predation: One species benefits, and the other is harmed, fitting the observed pattern.
Thus, the correct answer is Predation as it best explains the interaction dynamics shown in the graphs.
Important Questions from Competition
- Ecologists have studied the distributions of birds on archipelagos. Some studies found an interesting 'checkerboard' pattern within island groups. Sister species were never present on the same island, even when the islands were very close to each other. Which one of the following processes best explains this checkerboard pattern?
- Two bird species, A and B, are found on a single mountainside. A is a low-elevation species, found between 500 m and 1500 m Above Sea Level (ASL), while B is a high-elevation species, found between 1000 m and 2000 m ASL. At 1250 m ASL, species A and B have very different bill morphologies, but the bill morphology of species A at 500 m is very similar to the bill morphology of species B at 2000 m ASL. Which one or more of the following explain(s) the difference in bill morphology at 1250 m ASL?
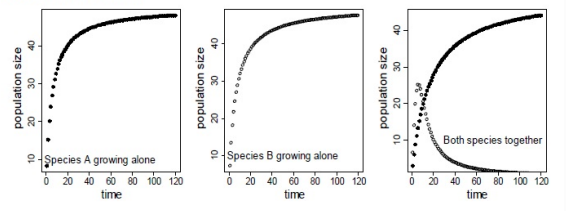
The figure panels below show population growth in two species (solid circles and open circles), when they are grown alone, and when they are grown together. The interaction between these species is an example of
- In an assemblage of coexisting wild cat species, the size of canine teeth was found to be strikingly different between these species. Which one or more of the following statements explain(s) this observation?
The barnacle species, Chthamalus stellatus (CS), is found only in the high intertidal zone whereas Balanus glandula (BG) is found only in the low intertidal zone. A researcher transplanted CS from the high to low (T-CS), and BG from the low to high (T-BG) intertidal zones. Additionally, they allowed the species to grow alone or in competition with each other, and quantified survival.
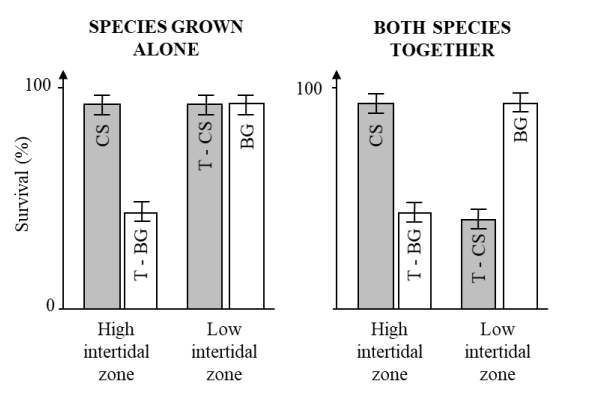
Which one or more of the following inferences is/are consistent with the experimental results shown below?


