The figure panels below show population growth in two species (solid circles and open circles), when they are grown alone, and when they are grown together. The interaction between these species is an example of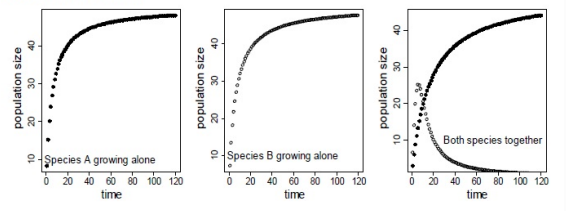
The figure panels in the question show the population growth of two species, represented by solid circles and open circles, when grown alone and together. We are asked to identify the interaction between these two species.
To solve this problem, let's analyze the figure:
- Species Growing Alone:
- The left panel shows the growth of the species represented by solid circles (Species A) when grown alone. The population size increases and eventually levels off, indicating typical logistic growth.
- The middle panel shows the growth of the species represented by open circles (Species B) when grown alone. Similarly, this species also follows a logistic growth pattern.
- Species Growing Together:
- The right panel illustrates the interaction when both species are grown together. Here, the population sizes of both species initially increase but then decline compared to when they were grown separately.
In this context:
- Mutualism: This would indicate both species benefit when together, leading to increased growth for both, which is not observed here.
- Predator-Prey Interaction: This involves one species benefiting at the expense of the other, which isn't supported by the observed data (both populations decline).
- Commensalism: One species benefits without affecting the other, whereas here, both species are negatively affected when together.
- Competition: Both species negatively impact each other's growth due to resource competition, which matches the observed decline in population sizes when grown together.
Conclusion: The interaction between these species is competition, as their growth rates decrease when they are together, indicating competition for shared resources.
Important Questions from Competition
- Ecologists have studied the distributions of birds on archipelagos. Some studies found an interesting 'checkerboard' pattern within island groups. Sister species were never present on the same island, even when the islands were very close to each other. Which one of the following processes best explains this checkerboard pattern?
- Two bird species, A and B, are found on a single mountainside. A is a low-elevation species, found between 500 m and 1500 m Above Sea Level (ASL), while B is a high-elevation species, found between 1000 m and 2000 m ASL. At 1250 m ASL, species A and B have very different bill morphologies, but the bill morphology of species A at 500 m is very similar to the bill morphology of species B at 2000 m ASL. Which one or more of the following explain(s) the difference in bill morphology at 1250 m ASL?
- In an assemblage of coexisting wild cat species, the size of canine teeth was found to be strikingly different between these species. Which one or more of the following statements explain(s) this observation?
The barnacle species, Chthamalus stellatus (CS), is found only in the high intertidal zone whereas Balanus glandula (BG) is found only in the low intertidal zone. A researcher transplanted CS from the high to low (T-CS), and BG from the low to high (T-BG) intertidal zones. Additionally, they allowed the species to grow alone or in competition with each other, and quantified survival.
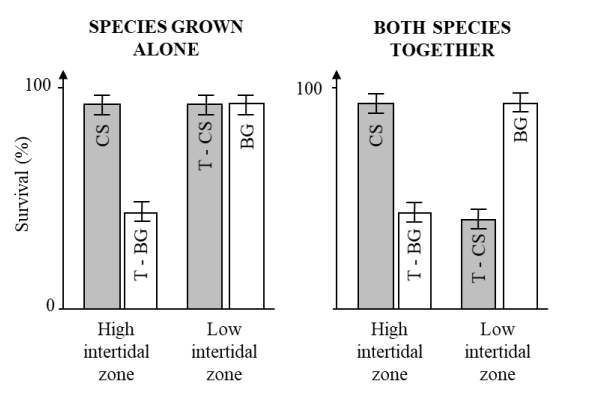
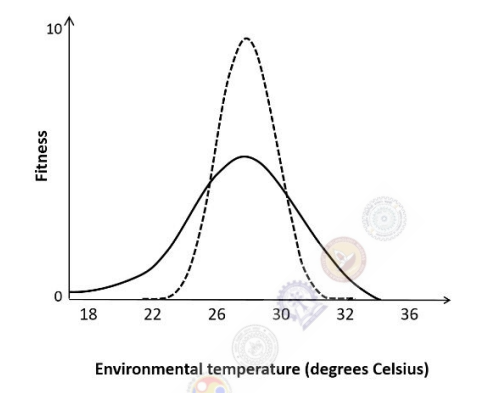
Which one or more of the following inferences is/are consistent with the experimental results shown below?Species 1 and 2 are sympatric, but species 2 has a wider physiological tolerance than species 1. The two species simultaneously invade a new environment that has an average temperature of 22 degrees C. What are the expected outcomes for species 1 and 2 ?