
The chart represents the domestic expenditure of a family per month with total expenditure being Rs. 33650 then the annual saving for provident fund is: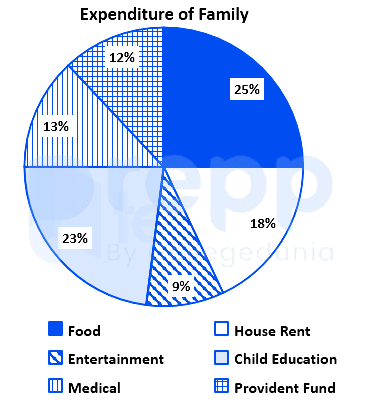
Rs. 48,456
Calculation:
The monthly expenditure of the family is 33650.
Expenditure on the Provident fund is 12%.
According to the question:
⇒ 12% × 33650
⇒ 4038
The annual savings on the provident fund is 4038 × 12 = Rs 48,456.
∴ Option 4 is the correct answer.
Similar Questions
The given figures depict the country-wise and age-wise distribution of the people who visit China for business setup.
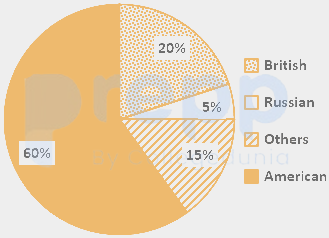
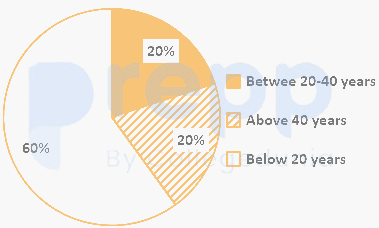
If in a given year, 500,000 people visited China, then the number of British nationals in the age group between 20 and 40 years who visited China is:
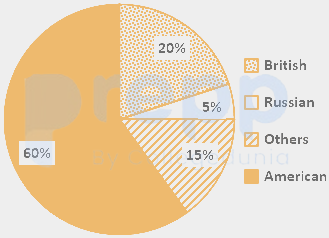
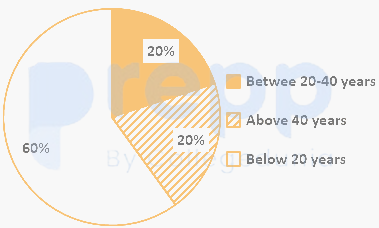
The above figure gives the country wise and age wise distribution of people who visit china for business set up
If in a given year 500000 visited china, then the number of American nationals who visited at with age group above 40 years is
The given figures depicts the country-wise and age-wise distribution of people who visit China for business set-up.
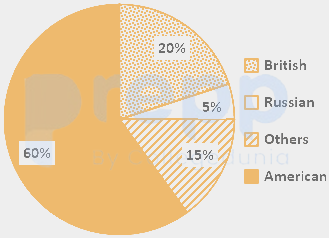
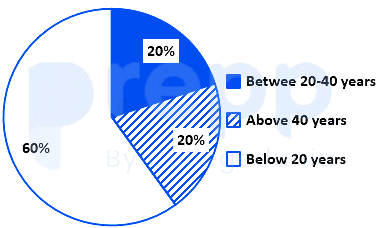
If in a given year, 500,000 people visited China, then the number of American nationals of the age group below 20 years who visited China is:
Important Questions from Pie Chart
Study the following pie-charts carefully to answer the questions.
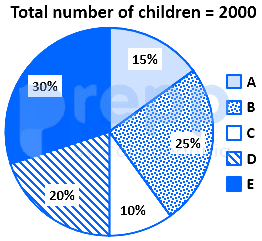
If 70 percent children from village D go to school then what is the number of children attending school from village D ?
Study the following pie-charts carefully to answer the questions.Percentage break-up of number of children in five different villages
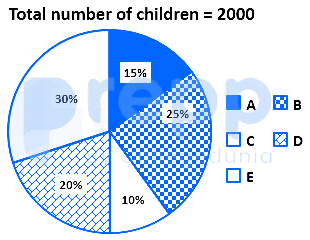
What is the respective ratio of total number of children from village A to village C ?
Study the following pie-charts carefully to answer the questions.Percentage break-up of number of children in five different villages
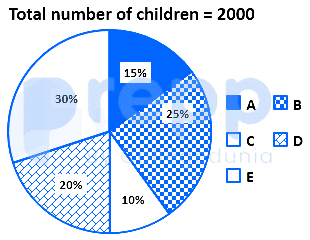
What is the total number of children in villages B and E ?
Study the chart and answer the question based, on the pie chart.The pie chart is given below shows expenditures incurred by a family on various items and savings in a month. Savings of the family is ₹ 8,000 in a month.
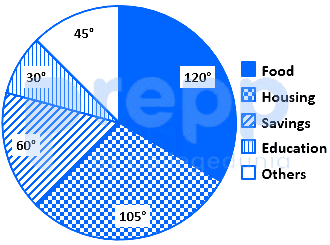
What is the total expenditure of the family for the month?
Study the chart and answer the question based, on the pie chart.The pie chart given below shows expenditures incurred by a family on various items and savings in a month. Savings of the family is ₹ 8,000 in a month.
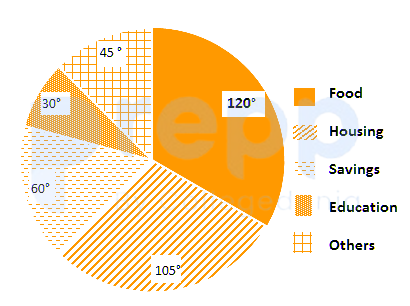
How much more amount is spent on food than on housing?



