The bar graph shows the number of males and females (in crores) in India during 1951-1991. Read the graph and answer the following questions: What was the approximate number of males in India in 1971 per thousands females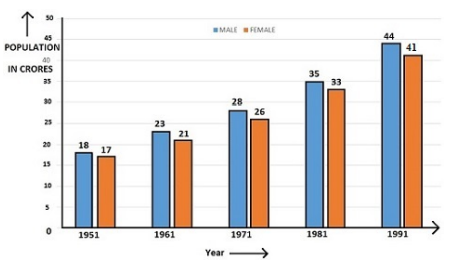
1077
To find the approximate number of males per 1000 females in India in 1971, we need to utilize the data provided in the bar graph for the number of males and females in India for the year 1971.
From the graph:
- Number of males in 1971: 27 crores
- Number of females in 1971: 25 crores
To calculate the number of males per 1000 females, use the formula:
Number of males per 1000 females = (Number of Males / Number of Females) * 1000
Insert the values:
Number of males per 1000 females = (27 / 25) * 1000
Simplifying, we get:
Number of males per 1000 females = 1.08 * 1000
Number of males per 1000 females = 1080
Since the options provided are approximate values, the closest value to our calculation is:
- 1077
Similar Questions
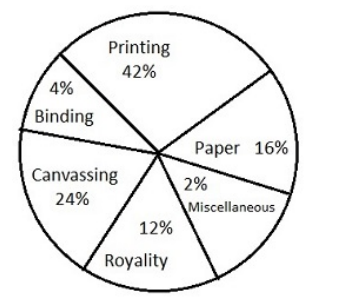
Study the chart and answer the questions. The pie chart given below shows the expenditure incurred in bringing out a book by a publisher.
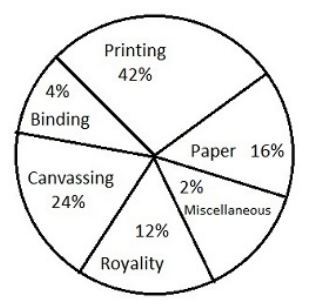
If the cost of printing is Rs. 16,800, the royalty is:
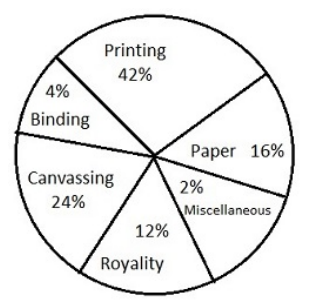
Royalty on the book is less than canvassing expenditure by
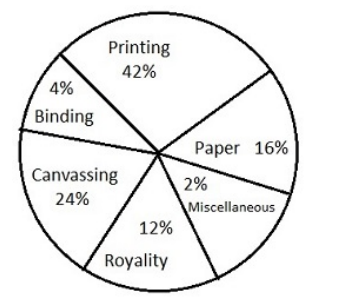
If miscellaneous expenditures amount to Rs. 12000, the expenditure on canvassing will be:
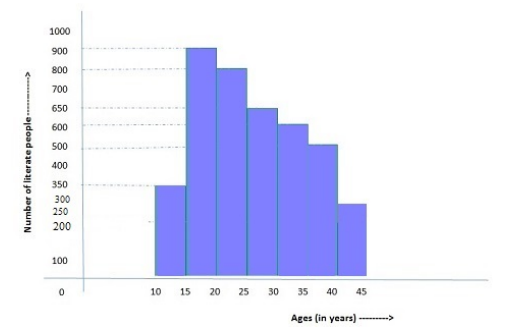
Percentage of the literate people in the age group 30-45 years is
The bar graph indicates the income of a firm. Study the graph and answer: Which period shows a steady increase of income?
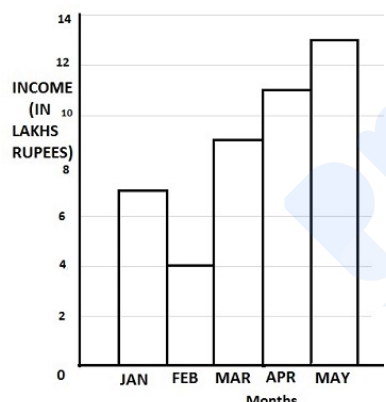
Which period shows a steady increase of income ?The bar graph indicates the income of a firm. Study the graph and answer: During which month, the ratio of the income to that of the previous month is the largest?
During which month, the ratio of the income to that of the previous month is the largest?The bar graph indicates the income of a firm. Study the graph and answer: The income in May is how many times to that of February?
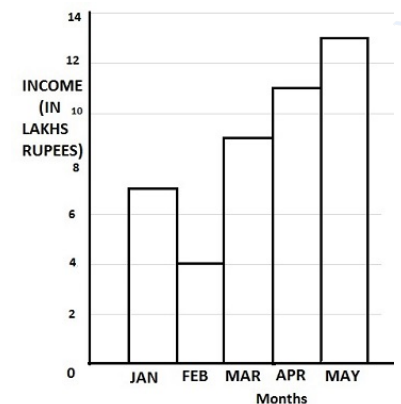
The income in May is how many times to that of February?The bar graph indicates the income of a firm. Study the graph and answer: The average monthly income of the firm (in lakh rupees) is
The average monthly income of the firm (in lakh rupees) isThe bar graph shows the number of males and females (in crores) in India during 1951-1991. Read the graph and answer the following questions:
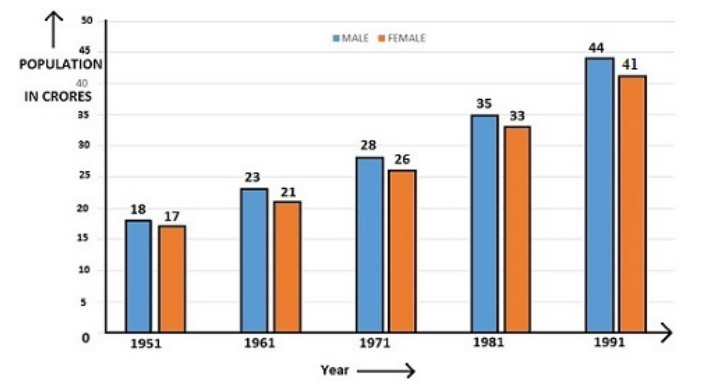
What was the approximate percentage of female population in India during 1991 ?
Important Questions from Pie Chart
Study the following pie-charts carefully to answer the questions.
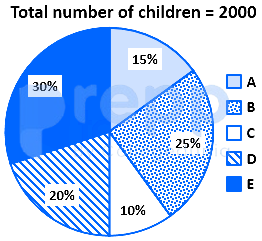
If 70 percent children from village D go to school then what is the number of children attending school from village D ?
Study the following pie-charts carefully to answer the questions.Percentage break-up of number of children in five different villages
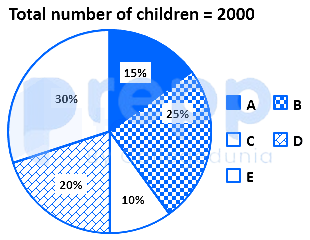
What is the respective ratio of total number of children from village A to village C ?
Study the following pie-charts carefully to answer the questions.Percentage break-up of number of children in five different villages
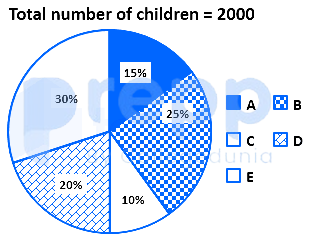
What is the total number of children in villages B and E ?
Study the chart and answer the question based, on the pie chart.The pie chart is given below shows expenditures incurred by a family on various items and savings in a month. Savings of the family is ₹ 8,000 in a month.
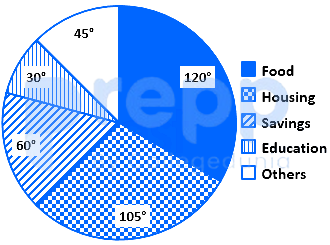
What is the total expenditure of the family for the month?
Study the chart and answer the question based, on the pie chart.The pie chart given below shows expenditures incurred by a family on various items and savings in a month. Savings of the family is ₹ 8,000 in a month.
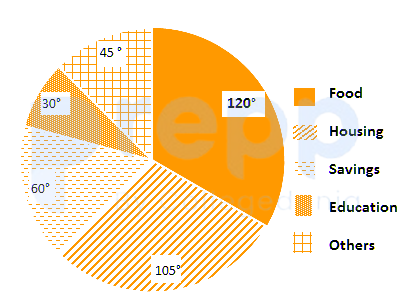
How much more amount is spent on food than on housing?