
Study the following table and answer the questions below. The table depicts the number of cars and bikes manufactured by a company in 2012 and 2013. How many cars (in thousands) were manufactured in the years 2012 and 2013 together?Years Number of cars (in thousands) Number of bikes (in thousand) 2012 45 50 2013 40 60
85
The correct answer is Option 1 i.e. 85.
Total cars manufactured in 2012 and 2013 = 45 + 40 = 85
Similar Questions
Study the following graph and answer the given question.
The bar graph shows the annual exports (in crores) of a company during the period 2015 to 2019.
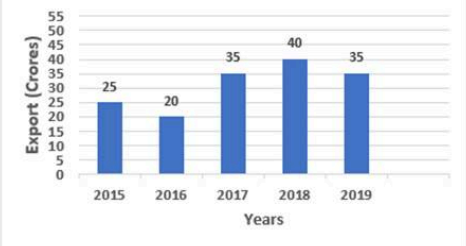
What is the respective ratio between the annual export of 2015 to the annual export of 2017?
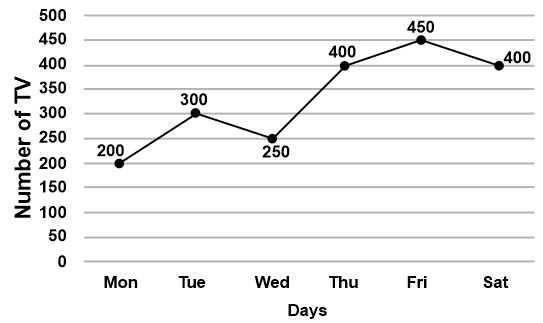
Study the given graph and answer the question that follows:
The graph shows the daily production of TV sets in a factory for 6 days of a week.
how many units of TV were produced on Monday and Tuesday together?
Study the following graph and answer the given question.
The graph shows the number of articles sold in a week by different shops.
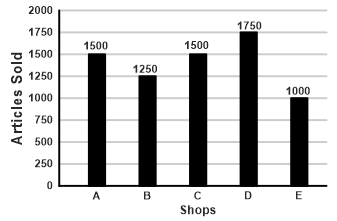
What percentage of articles did shop C sell more than shop B?
Study the following graph and answer the given question.
The given bar graph shows the annual production of rice in a state during the period of 2018 to 2022.
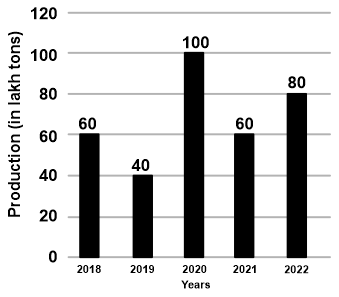
What is the total production of rice (in lakh tons) for the years 2020, 2021, and 2022 together?
Study the following table and answer the given question.
The table shows the expenditure of a family over the given years.
Year/Expenditure in ₹ Food Clothing Education Rent Others 2011 2000 1200 3300 2000 4000 2012 2500 1100 3200 2300 4100 What is the total expenditure (in ₹) on food by the family for the years 2011 and 2012?
Study the given table and answer the question that follows:
The table depicts the number of tickets sold on Friday and Saturday by cash and online mode for a ticket match.
Days Number of tickets sold(cash) Number of tickets sold(online) Friday 725 525 Saturday 1000 3000 How many tickets were sold in total on Friday by cash and online together?
Important Questions from Mixed Data Interpretation
Consider the following data:
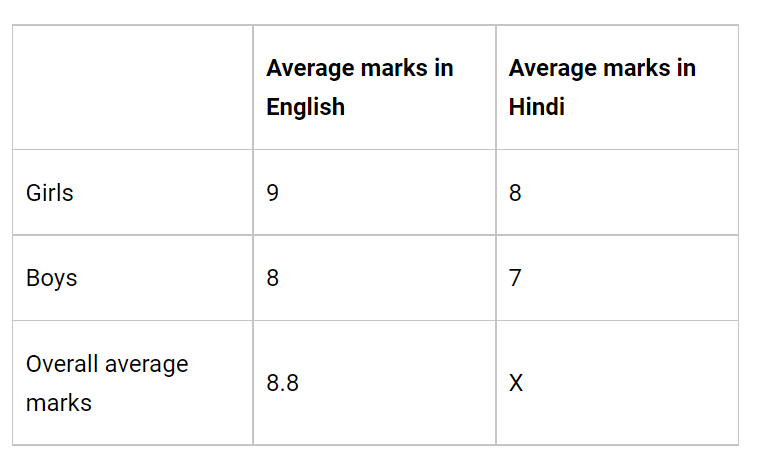
What is the value of x in the above table?
Seeta and Geeta go for a swim after a gap of every 2 days and every 3 days respectively. If on 1st January both of them went for a swim together, when will they go together next?
X, Y and Z are three contestants in a race of 1000 m. Assume that all run with different uniform speeds. X gives Y a start of 40 m and X gives Z a start of 64 m. If Y and Z were to compete in a race of 1000 m, how many metres start will Y give to Z?
If x is greater than or equal to 25 and y is less than or equal to 40, then which one of the following is always correct?
Ena was born 4 years after her parents' marriage. Her mother is three years younger than her father and 24 years older than Ena, who is 13 years old. At what age did Ena's father get married



