Select the Venn diagram that best represents the relationship between the following classes. Coca Cola, Wine, Soft drink.
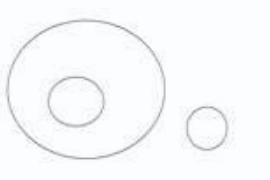
Understanding the Relationship Between Terms
The question asks to identify the Venn diagram that best illustrates the relationship between three distinct classes: Coca Cola, Wine, and Soft drink.
Analyzing the Categories
- Soft drink: This is a broad category referring to non-alcoholic beverages.
- Coca Cola: This is a specific brand name, which is a type of soft drink. Therefore, Coca Cola is a subset of Soft drinks.
- Wine: This is an alcoholic beverage, fundamentally different from soft drinks and Coca Cola.
Interpreting Venn Diagrams
Venn diagrams use circles to represent sets and their relationships:
- Separate circles: Indicate that the sets have no members in common (disjoint sets).
- Overlapping circles: Indicate that the sets share some common members.
- One circle inside another: Indicates that one set is a subset of the other (all members of the inner set are also members of the outer set).
Mapping Terms to the Correct Venn Diagram (Option D)
The provided correct answer corresponds to a Venn diagram featuring two overlapping circles and one separate circle.
Let's map the terms to this structure:
- Wine: As an alcoholic beverage, wine is entirely separate from soft drinks. It is correctly represented by the circle that does not overlap with any other.
- Coca Cola and Soft Drink: Logically, Coca Cola is a subset of Soft Drink. However, the Venn diagram in Option D shows these two categories as overlapping. This representation suggests they are related but not identical, possibly highlighting that Coca Cola shares characteristics with the broader category of 'Soft Drink' while also being a distinct entity within it, and that other types of soft drinks exist outside of Coca Cola. The diagram implies a relationship where neither category is fully contained within the other, but they do share common ground.
Therefore, the Venn diagram showing two overlapping circles (representing Coca Cola and Soft Drink) and one separate circle (representing Wine) is selected as the best fit according to the provided answer.
Similar Questions
- Who was the first person to fly into space?
- What is the full form of EVM?
- What is Nomophobia?
- Which is the following statements is INCORRECT?
- Which of the following pairs is not correct?
- Which of following country has the highest number of operational nuclear reactors currently?
Whose famous quote is this?
"If you cry because the sun has gone out of your life, your tears will prevent you from seeing the stars."
- Spicejet recently operated India's first ever biojet fuel flight. Which of the following institutes prepared the fuel?
- Which of the following is not correctly matched?
- The National Library of India is situated at:
Important Questions from Miscellaneous
The magazine in which Mahatma Gandhi mentioned what he wanted the Constitution to do is:
Which gas shields the surface of the earth from ultraviolet radiation from the sun?
Which event is marked as an Intangible Cultural Heritage of Humanity by UNESCO?
Who has been conferred with the rank of the Commander of the Order of the British Empire in 2018?
Who directead the film ‘Bhuvan Shome’?