
Percentage-wise distribution of all science students in a university is given in the pie-diagram. The bar chart shows the distribution of physics students in different sub-areas, where a student takes one and only one sub-area. What percentage of the total science students is girls studying quantum mechanics?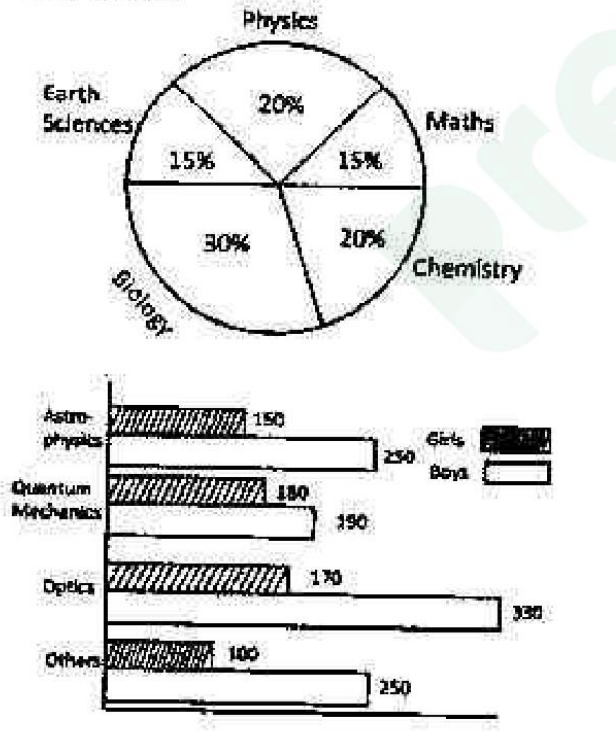
To find the percentage of the total science students who are girls studying quantum mechanics, we need to follow the steps below, using the given pie and bar charts.
- Determine the proportion of physics students among all science students.
- From the pie chart, the percentage of physics students is \(20\%\).
- Identify the distribution of girls in quantum mechanics.
- In the bar chart, the number of girls studying quantum mechanics is \(180\).
- Calculate the total number of quantum mechanics students.
- The total number of students studying quantum mechanics is \(180 + 150 = 330\).
- Calculate the fraction of physics students studying quantum mechanics.
- The fraction is given by \(\frac{330}{\text{Total Physics Students}}\).
- We know the total physics students account for \(20\%\) of all science students.
- Determine the percentage of science students who are girls in quantum mechanics.
- The fraction of girls among the quantum mechanics students is \(\frac{180}{330}\).
- Therefore, the percentage of the total science students who are girls studying quantum mechanics is:
- \(\left(\frac{180}{330}\right) \times \left(\frac{20}{100}\right) \times 100 = 2\%\).
Therefore, the correct answer is 2%.
Important Questions from Data Interpetation (Notes)
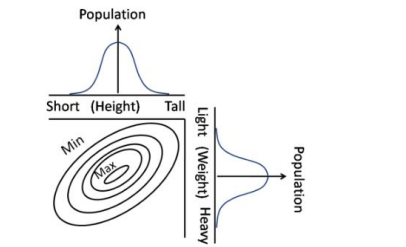
Contours in the bivariate (weight, height) graph connect regions of approximately equal popula-tions. Which of the following interpretations is correct?
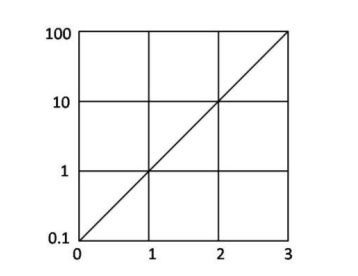
The function $f(x)$ is plotted against $x$ as shown. Extrapolate and find the value of the function at $x = -1$.
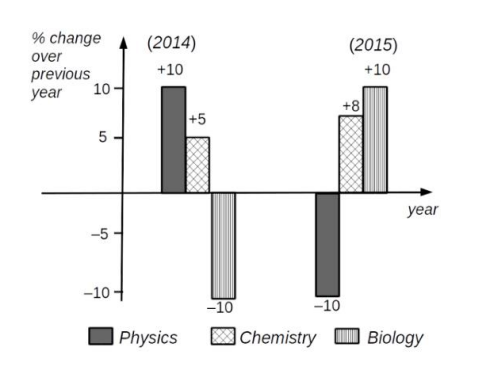
Which of the following inferences can be drawn from the above graph?
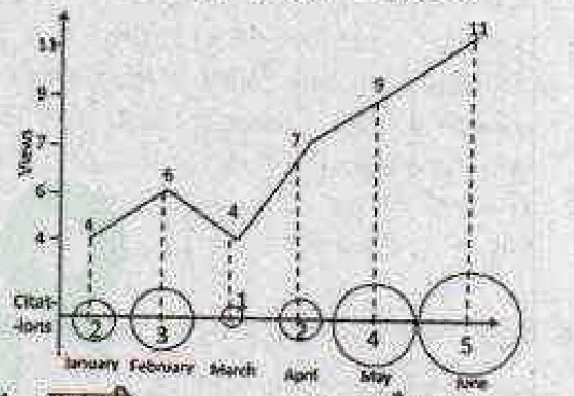
Number of times a research paper is viewed and cited is shown in the plot. In which month was the percentage increase in citation more than the double of the percentage increase in view?
- There are two examinations, A and B in a subject which are evaluated out of 30 and 70 marks, respectively. In order to pass the course the student has to get at least 40 % in total and at least 40 % in B. The following are the marks of the students $S_1$ to $S_4$.
Students A B $S_1$ 12 28 $S_2$ 10 29 $S_3$ 16 27 $S_4$ 05 29
The only student/s to have passed is/are


