Question
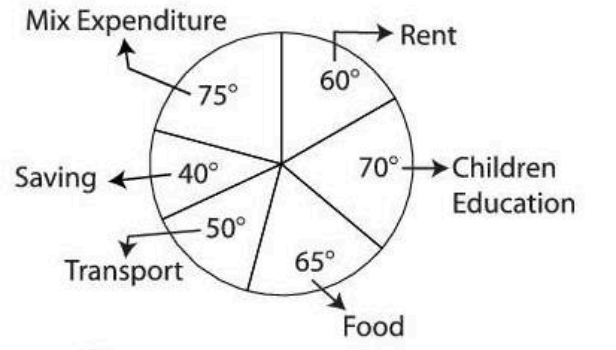
Percentage frequency distribution is represented by:
This question was previously asked in
CUET PG 2026 Agri-Business Management Question Paper (25-Mar-2026) (Shift 2)
The correct answer is
Pie chart
Percentage Frequency Distribution Representation
A percentage frequency distribution displays how often each category or value occurs within a dataset, expressed as a percentage of the total count. This method highlights the relative size or proportion of each category compared to the entire dataset.
Analyzing Representation Methods
- Frequency Table: Primarily a numerical display. While it can include a percentage column, it's not its main function as a *visual* representation of proportions.
- Frequency Polygon: A line graph connecting points that represent frequencies of class intervals. It illustrates the shape of the distribution but isn't ideal for showing percentage parts of a whole.
- Pie Chart: A circular chart divided into sectors. Each sector visually represents a category's proportion of the total dataset (100%). This is a direct and common method for visualizing percentage frequency distributions.
- Ogive Representation: This is a cumulative frequency graph. It shows the number or percentage of observations falling below a certain value, not the percentage breakdown of categories.
Identifying the Best Visual Tool
The pie chart is specifically designed to illustrate proportions and percentages, making it the most appropriate choice for representing a percentage frequency distribution visually.
Final Answer Confirmation
Based on the analysis, the graphical representation best suited for a percentage frequency distribution is the pie chart.
Correct Option: C - Pie chart
Was this answer helpful?
Similar Questions
- The Nanda Devi Biosphere Reserve is known for its conservation of endemic:
- Peptide based on the given sequence is called:
Cysteine-aspartate-glutamate-alanine - Liver exhibits which type of regeneration?
- What are the main components of replisome?
- Which of the following factors are required for complement activation by alternative pathway:
- Speciation rate is influenced by a number of factors except:
- Some animals living in the same habitat with inedible species sometimes evolve a coloration that resembles the warning coloration of a toxic species, then it is called:
- Klenow fragment is the modified enzyme of which DNA polymerase:
- The type of exocrine gland which forms its secretory product and releases it by exocytosis is:
- Which of the DNA will have higher melting temperature with below mentioned base compositions:
Important Questions from Mixed Topic (CUET PG)
- Which of the following variables are included in the Human Poverty Index?
(A). The probability of not surviving till the age of 40.
(B). The adult illiteracy rate.
(C). The number of people who do not have access to clean water.
(D). The number of small children who are underweight.
Choose the correct answer from the options given below: - Which of the following powers and responsibility are delegated to Panchayats?
(A). to prepare plans and schemes for economic development
(B). to promote schemes that will enhance social justice
(C). to levy, collect and appropriate taxes, duties, tolls and fees
(D). to help in the devolution of governmental responsibilities especially that of finances to local authorities
Choose the correct answer from the options given below: - Identify the sequence of art forms in India from East to West:
(A). Bhaona
(B). Jatra
(C). Ramlila
(D). Dashavatar
(E). Maach
Choose the correct answer from the options given below: - Which of the following ideas does the concept of 'Sustainability' in Human Development refer to ?
(A). Continuity in the availability of opportunities.
(B). Each future generation must have higher opportunities (At least double) than their previous generation.
(C). All environmental, financial and human resources must be used keeping in mind the future
(D). Each generation must ensure the availability of choices and opportunities to its future generations.
Choose the correct answer from the options given below: - The sequence of stages in active listening is
(A). Understanding
(B). Remembering
(C). Responding
(D). Receiving
(E) Evaluating
Choose the correct answer from the options given below:
Need Expert Advice?
Upcoming Exams
GATE
February 06, 2027
Test Series

CUET
CUET PG Psychology (HUQP20) 2026 Mock Test Series
10 Tests
825 Attempts
3.7(15)
English
More Questions from CUET PG