Problem Setup
We are given the following information about a group of 35 persons:
- Total number of persons = 35
- Number of young persons = 20
- Number of girls = 18
We need to find the number of young girls in this group.
Finding the Number of Young Girls
Let Y represent the set of young persons and G represent the set of girls.
We are given:
- The size of set Y, $|Y| = 20$
- The size of set G, $|G| = 18$
- The total number of persons in the group is 35.
We are looking for the number of individuals who are both young and girls, which corresponds to the intersection of the sets Y and G, denoted as $|Y \cap G|$.
The number of people who belong to at least one of the sets (Young or Girls) is represented by the union, $|Y \cup G|$. The formula relating union, intersection, and individual set sizes is:
$|Y \cup G| = |Y| + |G| - |Y \cap G|$Substituting the known values:
$|Y \cup G| = 20 + 18 - |Y \cap G|$ $|Y \cup G| = 38 - |Y \cap G|$The total number of people in the union ($|Y \cup G|$) cannot exceed the total number of people in the group, which is 35.
$|Y \cup G| \le 35$Combining the equations, we get:
$38 - |Y \cap G| \le 35$To find the minimum possible value for $|Y \cap G|$, we rearrange the inequality:
$38 - 35 \le |Y \cap G|$ $3 \le |Y \cap G|$This calculation indicates that the minimum number of young girls possible in the group is 3.
Result
Based on the provided numbers, the minimum number of young girls is 3.
Similar Questions
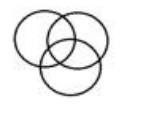
Select the Venn diagram that best represents the relationship between man, smokers and cricketers.
A)

B)

C)
D)

- In a class of 65 students, 20 students like only maths, 25 students like only English and 15 students like both English and maths. 8 students like computer and 3 students like all three subjects. There are no students who like Computers and English. Also, there are no students who like Maths and Computers. How many students like only computer?
- In a group of people, 8 persons like only Goa and 9 persons like only Dubai. There is only one person who likes only Agra. 10 persons like both Goa and Agra while 2 persons like both Dubai and Goa. There is no such person who likes both Agra and Dubai and there is no one in the group who likes all three. How many total persons are there in the group?
Select the Venn diagram that best represents the relationship between the given set of classes.
Citizens, Moon, Grains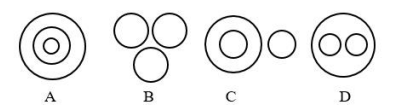
Select the Venn diagram that best represents the relationship between mother, father and women.
A)

B)

C)

D)
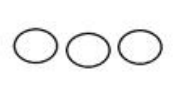
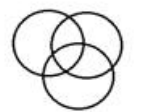
Select the Venn diagram that best represents the relationship between words, letters and sentence.
A)

B)

C)
D)

Study the diagram and identify the region representing teachers who are Chinese but not Indian.
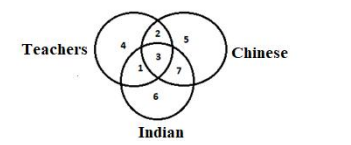
Study the diagram and identify the region representing teachers who are Indian and Chinese.
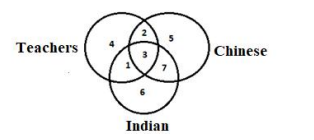
Study the diagram and identify the region representing teachers who are Indian but not Chinese.
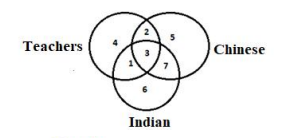
Select the Venn diagram that best represents the relationship of the classes:
papaya, fruit, potato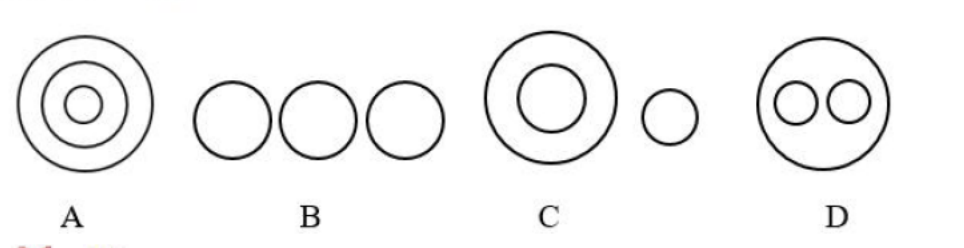
Important Questions from Venn Diagram
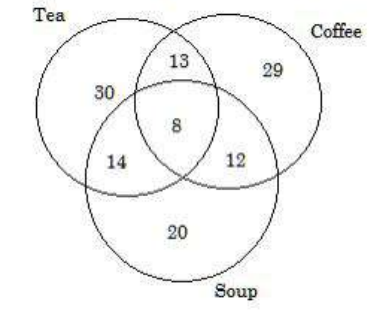
The following Venn diagram shows people’s liking for Tea, Coffee, and Soup. How many people like tea and coffee both?
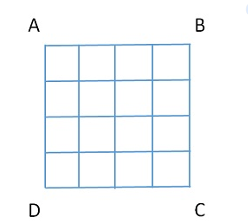
How many squares are there in the square figure ABCD?
Identify the diagram that best represents the relationship among classes given below: Men, Rodents and living beings
In an examination, 45 percent of students passed in history and 60 percent of students passed in Hindi. If 8 percent of students failed in both subjects, then what percentage of students passed in both subjects?
In a company of 1000 employees, 760 can speak Hindi and 430 can speak English. How many people can speak only Hindi, only English and both Hindi and English, respectively?