
In a company of 1000 employees, 760 can speak Hindi and 430 can speak English. How many people can speak only Hindi, only English and both Hindi and English, respectively?
570, 240, 190
Calculating Language Speakers in a Company
This problem involves understanding the distribution of language skills among employees using basic set theory principles. We are given the total number of employees and the number of employees who can speak Hindi and English.
Let:
- \(N\) = Total number of employees = 1000
- \(H\) = Set of employees who can speak Hindi
- \(E\) = Set of employees who can speak English
- \(|H|\) = Number of employees who can speak Hindi = 760
- \(|E|\) = Number of employees who can speak English = 430
We assume that every employee speaks at least one of the two languages. In set theory terms, this means the union of the two sets covers the entire group of employees, i.e., \(|H \cup E| = N\).
Finding the Number of Employees Speaking Both Languages
The principle of inclusion-exclusion for two sets is given by the formula:
\[|H \cup E| = |H| + |E| - |H \cap E|\]
Where \(|H \cap E|\) represents the number of employees who can speak both Hindi and English.
We know \(|H \cup E| = 1000\), \(|H| = 760\), and \(|E| = 430\). Substituting these values into the formula:
\[1000 = 760 + 430 - |H \cap E|\]
\[1000 = 1190 - |H \cap E|\]
Rearranging the formula to find \(|H \cap E|\):
\[|H \cap E| = 1190 - 1000\]
\[|H \cap E| = 190\]
So, 190 employees can speak both Hindi and English.
Finding the Number of Employees Speaking Only One Language
The number of employees who can speak only Hindi is the total number of Hindi speakers minus those who also speak English:
\[\text{Only Hindi} = |H| - |H \cap E|\]
\[\text{Only Hindi} = 760 - 190\]
\[\text{Only Hindi} = 570\]
The number of employees who can speak only English is the total number of English speakers minus those who also speak Hindi:
\[\text{Only English} = |E| - |H \cap E|\]
\[\text{Only English} = 430 - 190\]
\[\text{Only English} = 240\]
Summary of Results
Let's summarize the number of employees in each category:
| Category | Number of Employees |
|---|---|
| Only Hindi | 570 |
| Only English | 240 |
| Both Hindi and English | 190 |
| Total | \(570 + 240 + 190 = 1000\) |
The question asks for the numbers in the order: only Hindi, only English, and both Hindi and English, respectively. Based on our calculations, this order is 570, 240, and 190.
Important Questions from Venn Diagram
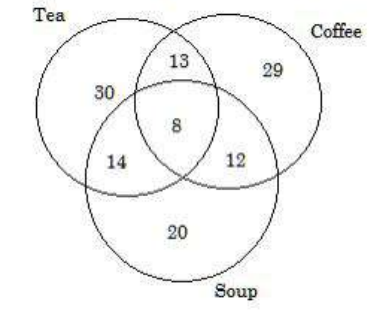
The following Venn diagram shows people’s liking for Tea, Coffee, and Soup. How many people like tea and coffee both?
How many squares are there in the square figure ABCD?

Identify the diagram that best represents the relationship among classes given below: Men, Rodents and living beings
In an examination, 45 percent of students passed in history and 60 percent of students passed in Hindi. If 8 percent of students failed in both subjects, then what percentage of students passed in both subjects?
Study the given Venn diagram carefully and answer the question that follows.
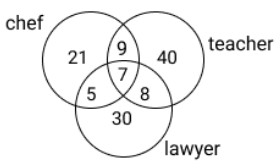
The numbers in different sections indicate the number of persons. How many chefs are there who are also teachers but not lawyers?


