
Calculating Carrying Capacity (K) in Logistic Growth
In logistic growth, the carrying capacity ($K$) represents the maximum sustainable population size. It's the point where the population growth rate becomes zero. This happens when the per capita birth rate ($b$) equals the per capita death rate ($d$).
Setting Birth Rate Equal to Death Rate
The provided per capita rates are:
- Birth rate: $b = 0.1 – 0.0001N$
- Death rate: $d = 0.01 + 0.00002N$
At carrying capacity ($K$, which is a specific population size $N$), $b = d$. So, we set the two equations equal:
$0.1 – 0.0001N = 0.01 + 0.00002N$
Solving for Population Size (N)
Rearrange the equation to solve for $N$:
$0.1 - 0.01 = 0.0001N + 0.00002N$
Combine like terms:
$0.09 = 0.00012N$
Isolate $N$:
$N = \frac{0.09}{0.00012}$
Calculate the value:
$N = \frac{900}{1.2} = \frac{9000}{12} = 750$
Carrying Capacity Determination
The population size $N$ where the birth rate equals the death rate is the carrying capacity ($K$).
Therefore, the carrying capacity ($K$) is 750 individuals.
Important Questions from Population growth curves
The population of whirligig beetles in a lake grows or declines exponentially i.e.
$N(t) = N(0)e^{rt}$
where $N(t)$ is the population size at time $t$, $N(0)$ is the initial population size and $r$ is the per capita rate of population change, occurring only due to birth and death.
A researcher tracks population sizes for a year and finds the following:Time interval Number of beetles at start Number of beetles at end January - March 1000 150 April – June 150 3013 July – September 3013 100 October - December 100 2009 Assuming that the individual birth rates remain constant throughout the year and only death rates are affected, which one or more of the following statements is/are true?
(In your calculations, round off the birth and date rates to two decimal places)- The population size at which net recruitment is the highest is also when the greatest amount can be harvested, while ensuring the long-term survival of the population. The amount harvested at this population size is known as
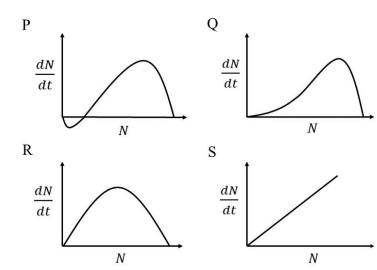
The graphs shown represent the relationship between population size ($N$) and population growth rate ($\frac{dN}{dt}$). Which one of the following growth curves represents a density-dependent population that experiences a strong Allee effect?
Overfishing reduced food availability for sea lions in California, causing a decline in their population size. In 1972, under the US Endangered Species Act, fishing was banned from sea lion foraging areas. Subsequently, the population of sea lions increased in a logistic form as shown in the figure.
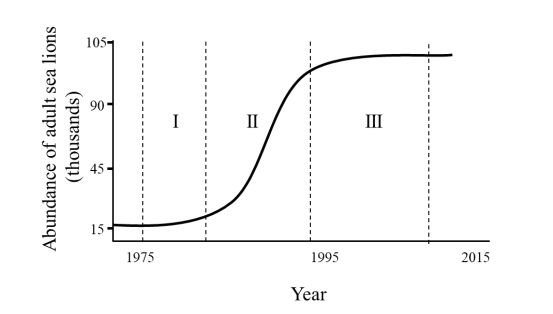
The per capita growth rate is highest in the interval __________ and the population growth rate is highest in the interval __________
Consider the logistic population growth model, given by $$ \frac{dn}{dt} = rn \left(1 - \frac{n}{k}\right) $$ where $r$ is the intrinsic growth rate, $n$ is the population size and $k$ is the carrying capacity. Which one or more of the following is/are assumption(s) of the model?


