
Maximum Sustainable Yield Explained
The question describes the population size where net recruitment is highest, allowing for the maximum harvest without threatening the population's long-term survival. This specific concept is known as the maximum sustainable yield.
Understanding Key Ecological Terms
Let's look at the options:
- Maximum Sustainable Yield (MSY): This refers to the largest yield (or catch) that can be taken from a species' stock over an indefinite period. It occurs at the population size where the growth rate is maximized, balancing harvest with population renewal.
- Carrying Capacity: This is the maximum population size that an environment can sustain indefinitely, given the available resources. At carrying capacity, the population growth rate is typically zero, not maximal for harvesting.
- Maximum Survival Density: This term is not standard ecological terminology for harvest management. Survival is related to density, but this specific phrase doesn't define the point of maximum harvestable surplus.
- Optimal Recruitment: While high recruitment is necessary for MSY, 'optimal recruitment' itself doesn't specifically define the harvestable amount or the population size yielding the greatest harvest. MSY is the outcome of optimal conditions for harvest.
Therefore, the population size yielding the greatest harvest sustainably is the definition of maximum sustainable yield.
Important Questions from Population growth curves
- A flask containing nutrient-rich media is seeded with 100 isogenic bacteria. Assuming that no bacteria die in the flask, after approximately how many generations will the population reach a size of $10^5$?
Population growth of a species can be modelled as $$ \frac{dN(t)}{dt} = rN(t)\left(1 - \frac{N(t)}{K}\right) $$ where $N(t)$ is the population size at time $t$; $r$ is the growth rate; and $K$ is the carrying capacity of the environment.
For $K = 9000$, $\frac{dN(t)}{dt}$ is maximized at $N =$ _____
(Answer in integer)
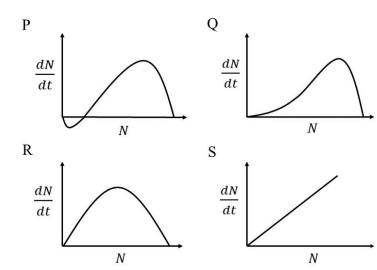
The graphs shown represent the relationship between population size ($N$) and population growth rate ($\frac{dN}{dt}$). Which one of the following growth curves represents a density-dependent population that experiences a strong Allee effect?
Overfishing reduced food availability for sea lions in California, causing a decline in their population size. In 1972, under the US Endangered Species Act, fishing was banned from sea lion foraging areas. Subsequently, the population of sea lions increased in a logistic form as shown in the figure.
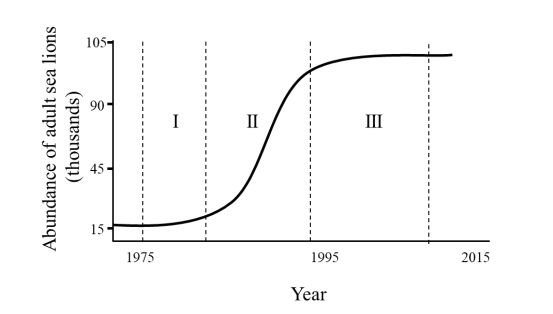
The per capita growth rate is highest in the interval __________ and the population growth rate is highest in the interval __________
- A population grows as per the equation $dn/dt = rn (1-n/1000)$ where $n$ is the population density, $r$ is the intrinsic growth rate and 1000 is the carrying capacity. The growth rate of the population is maximum at a population density of ________


