
The graphs shown represent the relationship between population size ($N$) and population growth rate ($\frac{dN}{dt}$). Which one of the following growth curves represents a density-dependent population that experiences a strong Allee effect?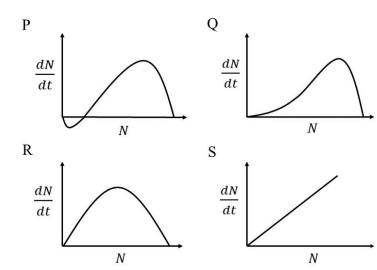
The question requires identifying the graph that represents a density-dependent population experiencing a strong Allee effect. Let's break down the concepts:
- Density-Dependent Population: This refers to populations where the growth rate changes with population size, often slowing down as resources become limited.
- Allee Effect: The Allee effect describes a situation where the population growth rate is lower at small population sizes. The "strong" Allee effect means there's a critical population size below which the population growth rate becomes negative, leading to a decline if not corrected.
Now, let's analyze the graphs:
- Graph P: Initially, the growth rate is negative at small population sizes, indicating a decline, which is characteristic of the strong Allee effect. As the population increases beyond a critical size, the growth rate becomes positive, allowing population growth.
- Graph Q: The growth rate is always positive but decreases as population size increases, showing density dependence, but it doesn't indicate an Allee effect.
- Graph R: Displays density dependence, showing an increase and then a decrease in growth rate with population size, but no negative growth rate at small population sizes.
- Graph S: A linear increase suggests density-independent growth, which does not illustrate the Allee effect.
Based on this analysis, Graph P correctly represents a density-dependent population with a strong Allee effect.
Conclusion: The correct answer is Option P.
Important Questions from Population growth curves
- A flask containing nutrient-rich media is seeded with 100 isogenic bacteria. Assuming that no bacteria die in the flask, after approximately how many generations will the population reach a size of $10^5$?
Population growth of a species can be modelled as $$ \frac{dN(t)}{dt} = rN(t)\left(1 - \frac{N(t)}{K}\right) $$ where $N(t)$ is the population size at time $t$; $r$ is the growth rate; and $K$ is the carrying capacity of the environment.
For $K = 9000$, $\frac{dN(t)}{dt}$ is maximized at $N =$ _____
(Answer in integer)
- The population size at which net recruitment is the highest is also when the greatest amount can be harvested, while ensuring the long-term survival of the population. The amount harvested at this population size is known as
Overfishing reduced food availability for sea lions in California, causing a decline in their population size. In 1972, under the US Endangered Species Act, fishing was banned from sea lion foraging areas. Subsequently, the population of sea lions increased in a logistic form as shown in the figure.
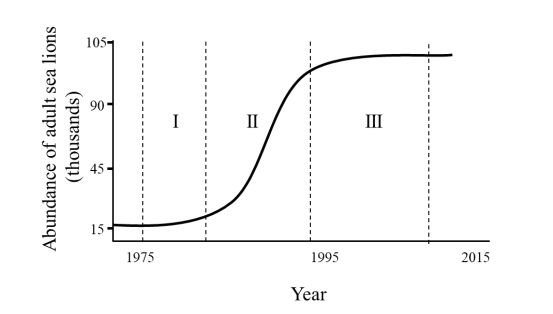
The per capita growth rate is highest in the interval __________ and the population growth rate is highest in the interval __________
- A population grows as per the equation $dn/dt = rn (1-n/1000)$ where $n$ is the population density, $r$ is the intrinsic growth rate and 1000 is the carrying capacity. The growth rate of the population is maximum at a population density of ________


