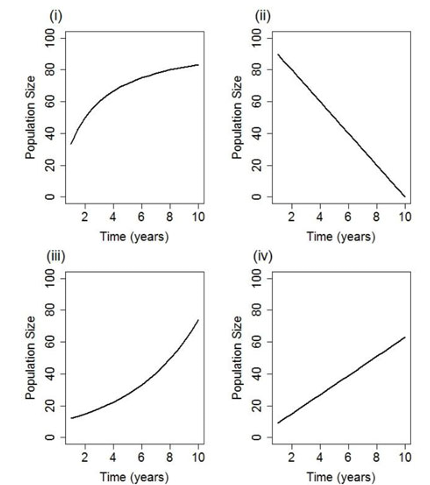
The population of whirligig beetles in a lake grows or declines exponentially i.e. $N(t) = N(0)e^{rt}$ where $N(t)$ is the population size at time $t$, $N(0)$ is the initial population size and $r$ is the per capita rate of population change, occurring only due to birth and death. Assuming that the individual birth rates remain constant throughout the year and only death rates are affected, which one or more of the following statements is/are true?
A researcher tracks population sizes for a year and finds the following:Time interval Number of beetles at start Number of beetles at end January - March 1000 150 April – June 150 3013 July – September 3013 100 October - December 100 2009
(In your calculations, round off the birth and date rates to two decimal places)
The population growth is modeled by $N(t) = N(0)e^{rt}$, where $r$ is the per capita rate of population change. The rate $r$ can be calculated using $r = \frac{1}{t} \ln\left(\frac{N(t)}{N(0)}\right)$. The time interval for each period is 3 months, equivalent to $t=0.25$ years. The per capita rate $r$ is the difference between the per capita birth rate ($b$) and the per capita death rate ($d$), i.e., $r = b - d$. Since birth rates ($b$) are constant and only death rates ($d$) are affected, $d = b - r$. Thus, comparing death rates involves comparing $b-r$ values.
Calculating Per Capita Growth Rates ($r$)
Using the provided population data and $t=0.25$ years, the per capita growth rate ($r$) for each interval is calculated:
| Time interval | Number of beetles at start ($N(0)$) | Number of beetles at end ($N(t)$) | $r$ (per year, rounded to 2 decimal places) |
| January - March | 1000 | 150 | $4 \ln(150/1000) \approx -7.59$ |
| April – June | 150 | 130 | $4 \ln(130/150) \approx -0.57$ |
| July – September | 130 | 100 | $4 \ln(100/130) \approx -1.05$ |
| October - December | 100 | 200 | $4 \ln(200/100) \approx 2.77$ |
Analyzing Death Rates ($d$)
Given $r = b - d$, the death rate is $d = b - r$. Since $b$ is constant, differences in $d$ depend on differences in $r$. The death rates ($d_i$) for each interval can be expressed in terms of the constant birth rate $b$:
- $d_{\text{Jan-Mar}} = b - (-7.59) = b + 7.59$
- $d_{\text{Apr-Jun}} = b - (-0.57) = b + 0.57$
- $d_{\text{Jul-Sep}} = b - (-1.05) = b + 1.05$
- $d_{\text{Oct-Dec}} = b - 2.77$
Evaluating Statements
The question asks to identify which statements are true. Based on the analysis of death rates:
- Statement A: "The death rate during April–June is equal to that during October-December"
This statement compares $d_{\text{Apr-Jun}}$ ($b + 0.57$) and $d_{\text{Oct-Dec}}$ ($b - 2.77$). This statement is true.
- Statement C: "The death rate during July-September is higher than that during January-March"
This statement compares $d_{\text{Jul-Sep}}$ ($b + 1.05$) and $d_{\text{Jan-Mar}}$ ($b + 7.59$). This statement is true.
Therefore, statements A and C are the true statements.
Important Questions from Population growth curves
- The population size at which net recruitment is the highest is also when the greatest amount can be harvested, while ensuring the long-term survival of the population. The amount harvested at this population size is known as
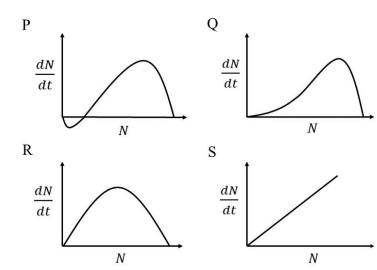
The graphs shown represent the relationship between population size ($N$) and population growth rate ($\frac{dN}{dt}$). Which one of the following growth curves represents a density-dependent population that experiences a strong Allee effect?
Overfishing reduced food availability for sea lions in California, causing a decline in their population size. In 1972, under the US Endangered Species Act, fishing was banned from sea lion foraging areas. Subsequently, the population of sea lions increased in a logistic form as shown in the figure.
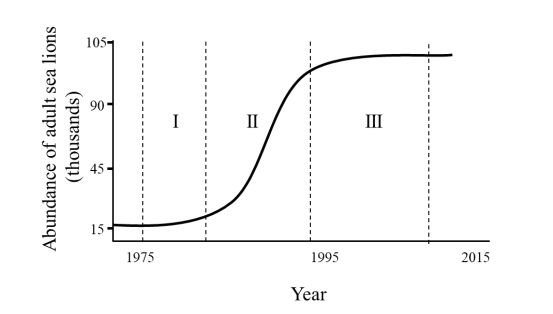
The per capita growth rate is highest in the interval __________ and the population growth rate is highest in the interval __________
Consider the logistic population growth model, given by $$ \frac{dn}{dt} = rn \left(1 - \frac{n}{k}\right) $$ where $r$ is the intrinsic growth rate, $n$ is the population size and $k$ is the carrying capacity. Which one or more of the following is/are assumption(s) of the model?
A population of unicorns is growing over time, but its rate of growth is declining. Which of the following graphs best represents this pattern of growth?