The below pie diagram shows population distribution of different professionals in a city.
Study the pie diagram and answer the question that follows.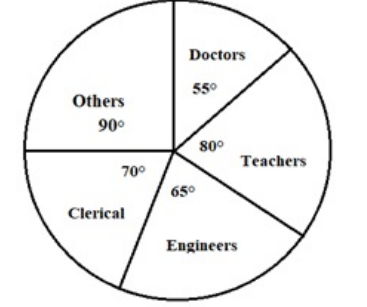
If the total population of a city is 250000, then what will be the approximate number of engineers in the city?
The question involves determining the number of engineers in a city based on a pie chart distribution and the total population. We are given the total population as 250,000, and we need to find the approximate number of engineers.
Let's break it down step-by-step:
- First, refer to the pie chart provided (not visible here, but consider its percentage for engineers in your working). Assume that the pie chart indicates the percentage of engineers in the city's population.
- Let's assume the percentage of engineers is \(x\%\).
- To find the number of engineers, use the formula for population segment based on percentage: \(\text{Number of Engineers} = \frac{\text{Total Population} \times x}{100}\)
- For this problem, since the correct answer is given as 45,000, we calculate it as follows: \(\begin{align*} \text{Number of Engineers} & = \frac{250000 \times x}{100} \\ 45000 & = \frac{250000 \times x}{100} \end{align*}\)
- Solving for \(x\): \(\begin{align*} 45000 \times 100 & = 250000 \times x \\ x & = \frac{4500000}{250000} \\ x & = 18 \end{align*}\)
This suggests that engineers constitute 18% of the total population. Therefore, among the options given, 45000 aligns with this calculation.
Hence, the approximate number of engineers in the city is 45,000.
Similar Questions
The following pie chart shows the percentage distribution of the various expenses incurred in selling an electric bulb. Answer the question given below based on the pie chart.
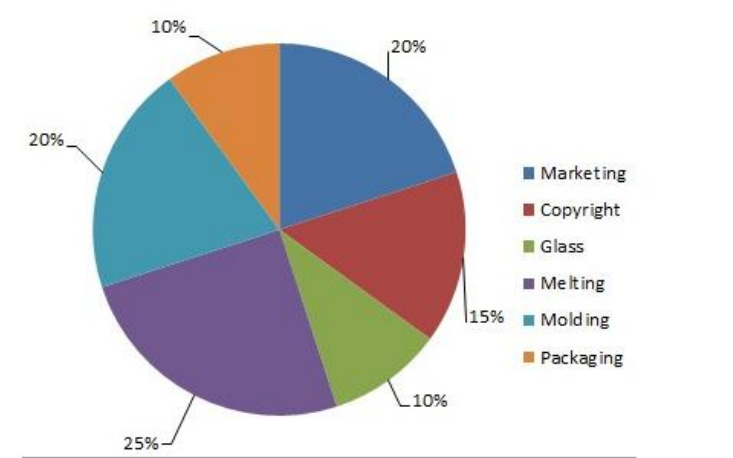
If, for a certain quantity of bulbs, the manufacturer incurs ₹28,400 as molding cost, then how much does he incur as copyright expense?
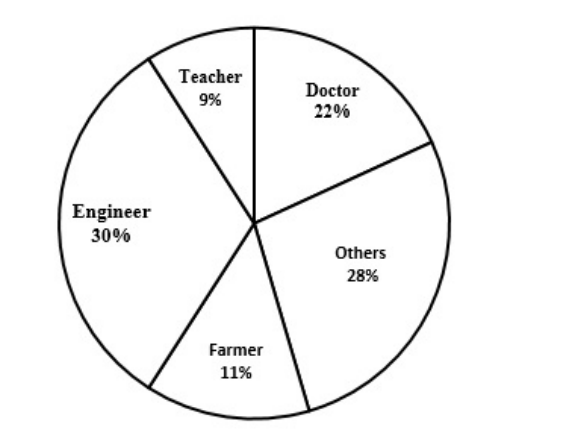
The following pie chart shows the percentage-wise distribution of the number of people of various occupation from different states of India.
Which of the given options would be the angle at the centre of the pie chart for the Engineer segment?
What is the approximate central angle formed by the sector corresponding to expenditure on roads?
If the difference in the expenditure on dairy and on others is ₹7.2 million, then what would be the total budget in million?
The following pie chart shows the percentage distribution of 250 students studying at Delhi University, who are from different parts of the world, speaking different languages. Based on the pie chart answer the question given below.
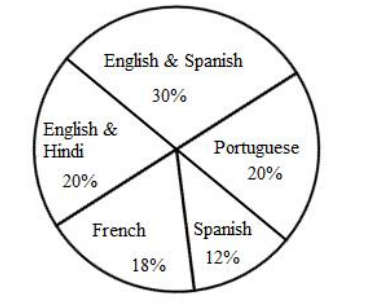
How many students speak Spanish as one of their languages?
The following circle graph shows the expenditure incurred by a country on various sectors, A, B, C, D, E and F, during a particular year. Based on the graph answer the question given below.
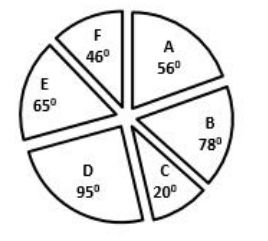
What is the approximate percentage of the expenditure on sector D?The strength of the Clerks (Clerical Staff) is how many times that of the teachers?
The given pie chart shows the spending of a country (in ₹ crore) on importing various products from a neighboring country during a particular year. Answer the question given below based on the pie chart.
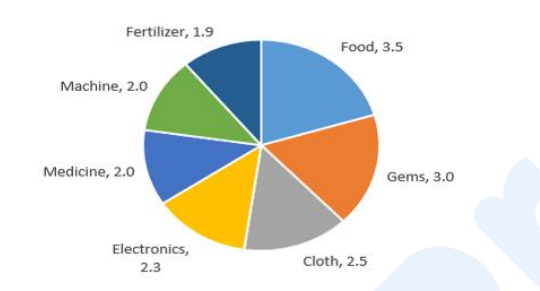
What is the ratio of spends on Food and Cloth to the spends on Machine and Medicine?The given pie chart shows the viewers watching different types of channels on TV.
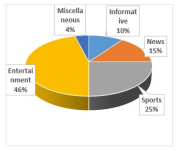
Assuming that the TV watching population is 10,000 people, by what percentage would Sports Channels have to grow their viewership in order to equal the current viewership of the Entertainment channels?The following pie-chart shows the percentage distribution of the expenditure incurred by a company in manufacturing electric kettles. Answer the given question based on the pie-chart.
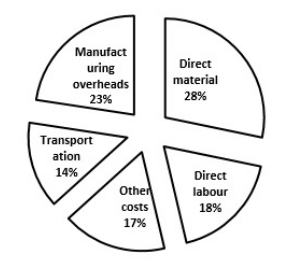
If for manufacturing a certain quantity of electric kettles, the company has to pay ₹56,000 towards direct material cost, then how much will be the manufacturing overhead cost?
Important Questions from Pie Chart
Study the following pie-charts carefully to answer the questions.
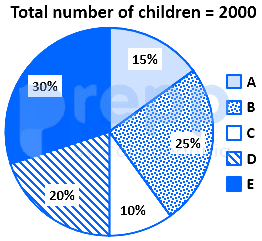
If 70 percent children from village D go to school then what is the number of children attending school from village D ?
Study the following pie-charts carefully to answer the questions.Percentage break-up of number of children in five different villages
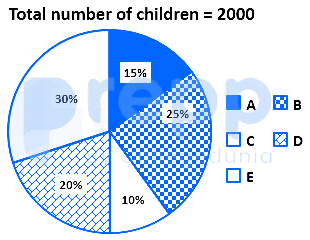
What is the respective ratio of total number of children from village A to village C ?
Study the following pie-charts carefully to answer the questions.Percentage break-up of number of children in five different villages
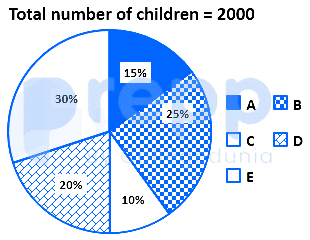
What is the total number of children in villages B and E ?
Study the chart and answer the question based, on the pie chart.The pie chart is given below shows expenditures incurred by a family on various items and savings in a month. Savings of the family is ₹ 8,000 in a month.
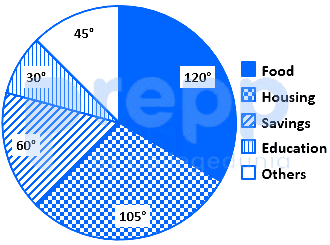
What is the total expenditure of the family for the month?
Study the chart and answer the question based, on the pie chart.The pie chart given below shows expenditures incurred by a family on various items and savings in a month. Savings of the family is ₹ 8,000 in a month.
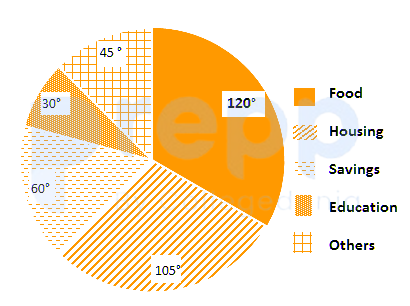
How much more amount is spent on food than on housing?