
Given figure represents pH, partial pressure of CO$_2$ (pCO$_2$), and temperature (T) in an experiment conducted in a water sample over 20 days. Which of the following statements can definitely be made based on this experiment?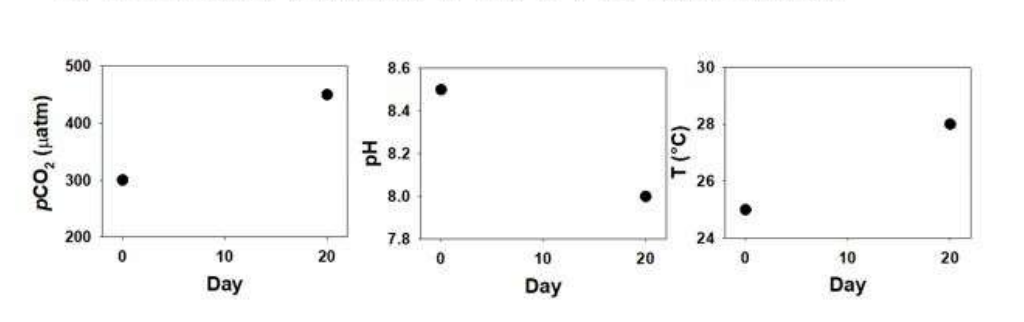
The given figure shows the variation of partial pressure of CO2 (pCO2), pH, and temperature (T) over 20 days in a water sample. We need to analyze this data to determine which statement can definitely be made based on the experiment.
- Analyzing the graph for pCO2:
- pCO2 starts at a lower value and increases over the 20 days.
- Analyzing the graph for pH:
- pH starts high and decreases over the 20 days.
- Analyzing the graph for temperature (T):
- Temperature starts lower and increases over the 20 days.
Based on the analyzed data, we can conclude the following about the provided options:
- High CO2 causes global warming: While this statement is scientifically relevant, it is not directly supported or proven by the data from this specific experiment.
- High temperature causes acidification: While increased temperature can lead to acidification, this statement cannot be definitively concluded solely from the given graphs.
- There is a decrease in pH and an increase in both T and pCO2 over 20 days: This statement directly corresponds with the observed data from the graphs.
- pH and pCO2 are positively correlated while pH and T are inversely correlated: The graphs show a decrease in pH while both T and pCO2 increase, which suggests a negative correlation with pH for both factors rather than a positive one with pCO2.
Therefore, the statement that can definitely be made based on the experiment is:
There is a decrease in pH and an increase in both T and pCO2 over 20 days.
Important Questions from Data Interpetation (Notes)
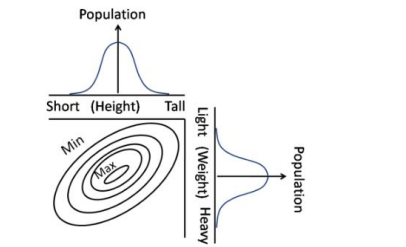
Contours in the bivariate (weight, height) graph connect regions of approximately equal popula-tions. Which of the following interpretations is correct?
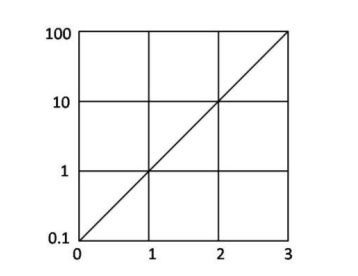
The function $f(x)$ is plotted against $x$ as shown. Extrapolate and find the value of the function at $x = -1$.
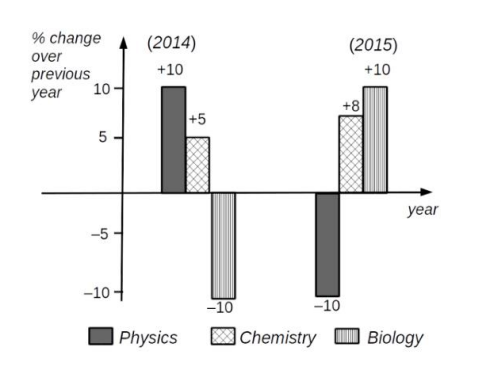
Which of the following inferences can be drawn from the above graph?
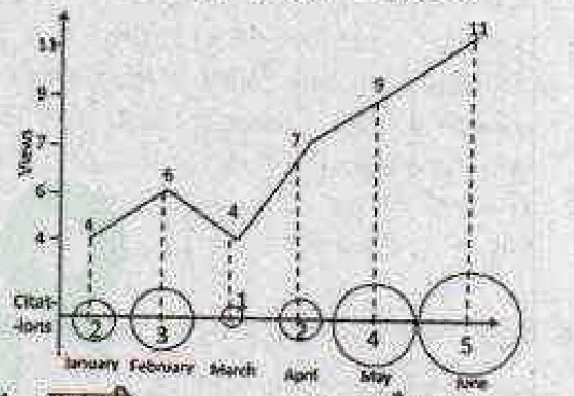
Number of times a research paper is viewed and cited is shown in the plot. In which month was the percentage increase in citation more than the double of the percentage increase in view?
- There are two examinations, A and B in a subject which are evaluated out of 30 and 70 marks, respectively. In order to pass the course the student has to get at least 40 % in total and at least 40 % in B. The following are the marks of the students $S_1$ to $S_4$.
Students A B $S_1$ 12 28 $S_2$ 10 29 $S_3$ 16 27 $S_4$ 05 29
The only student/s to have passed is/are


