
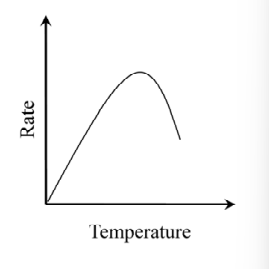
Enzyme Reaction Rate vs. Temperature Relationship
Enzyme activity is strongly influenced by temperature changes. The relationship between the reaction rate and temperature for an enzyme follows a specific pattern:
- Initial Increase: At lower temperatures, the reaction rate is slow because molecules have less kinetic energy, leading to fewer enzyme-substrate collisions.
- Rising Rate: As temperature increases, molecules gain kinetic energy. This results in more frequent and energetic collisions, increasing the reaction rate.
- Optimal Temperature: Enzymes exhibit maximum activity at a specific temperature, known as the optimal temperature.
- Sharp Decrease: Beyond the optimal temperature, the enzyme begins to denature. The heat disrupts the enzyme's three-dimensional structure, particularly the active site, causing a rapid loss of function and a steep drop in the reaction rate.
Therefore, a plot of reaction rate versus temperature for an enzyme typically shows an increase up to the optimal temperature, followed by a sharp decrease at higher temperatures. This creates a characteristic asymmetric bell-shaped curve.
The correct plot visually represents this phenomenon, illustrating the rise in rate to an optimum and the subsequent decline due to denaturation.
Important Questions from Enzyme Kinetics Michaelis Menten K_m V_{max}
- An enzyme following Michaelis-Menten kinetics, catalyses a reaction with an initial velocity ($V_0$) of $2\ \mu\text{M s}^{-1}$ at the substrate concentration of $10\ \mu\text{M}$. If the turnover number ($k_{\text{cat}}$) of the enzyme for the given substrate is $500\ \text{s}^{-1}$ and the enzyme concentration in the reaction is $0.01\ \mu\text{M}$, then the value of the Michaelis-Menten constant ($K_m$) would be__________ $\times\ 10^{-6}\ \text{M}$ (in integer).
The graph below shows the activity of enzyme pepsin in the presence of inhibitors aliphatic alcohols (P) or N-acetyl-1-phenylalanine (Q). Which ONE of the following represents the nature of inhibition by P and Q, respectively?
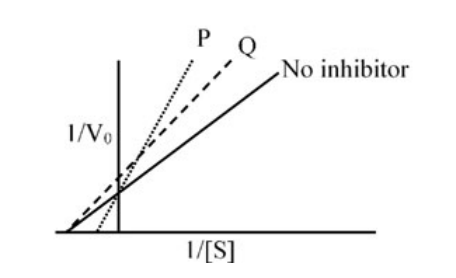
The following plot represents the Lineweaver-Burk equation of an enzymatic reaction both in the presence and the absence of inhibitor. Here, V is the velocity of reaction and S is the substrate concentration.
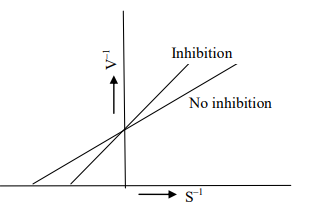
The nature of inhibition shown in the plot is
- In an enzyme catalyzed reaction, the initial reaction velocity is only one fourth of its maximum velocity. If the substrate concentration is $3.0 \times 10^{-3}$ mM, the value of $K_m$ in micro molar ($\mu$M) will be ....
- The Lineweaver-Burk plot of an enzymatic reaction shows $V_{max}$ of $160 \, \mu mol/l.min$ and $k_m$ of $60 \, \mu mol/l$. For a substrate concentration of $40 \, \mu mol/l$, the velocity of the reaction is estimated to be __________ $\mu mol/l.min$.


