
Direction: A line graph is given below, study the graph carefully and answer the following questions. Based on the given graph, the difference in the earnings was the highest between which of the two consecutive days: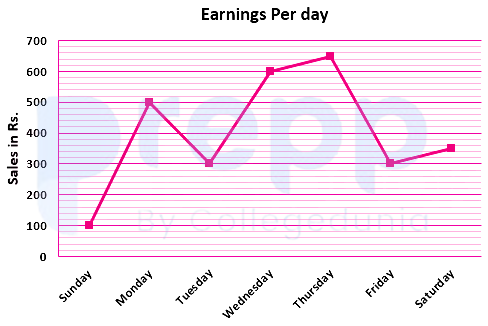
Sunday and Monday
Earning on Sunday = 100
Earning on Monday = 500
Earning on Tuesday = 300
Earning on Wednesday = 600
Earning on Thursday = 650
Earning on Friday = 300
Earning on Saturday = 350
∴ The difference in earnings was highest between Sunday and Monday.Similar Questions
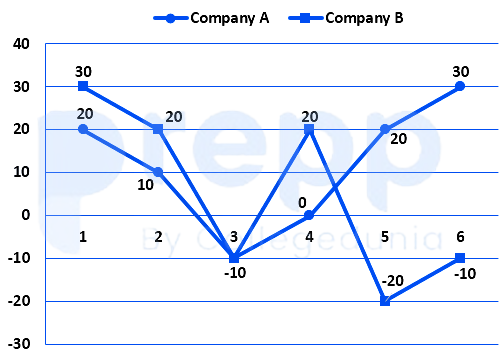
The line graphs show the profit (in lakh rupees), for 6 years, of two companies A and B. The ratio of the cumulative profits for these 6 years of Company B to Company A is:
Important Questions from Line Graph
What is the difference between the total production of Ford and Tata motors in the given years?
What is the average number of cars manufactured by Honda over the given period?
The production of Honda in 2018 was approximately what percent of the production of Tata Motors in the same year?
What is the difference between the number of cars manufactured by Ford in the year 2018 and 2019?
What is the average of all the cars manufactured by Tata Motors and Honda in 2016 and 2019?



