Latest Job Loss/Gain by regions (in thousands) Previous total job By region (in Lakhs) North +33 North 18 North-East +70 North-East 14 North-West +172 North-West 22 South -360 South 24 South-East -270 South-East 16 South-West -140 South-West 23
Which of the following statements are true while considering the above table ?
A. New number of jobs for South-West is 21,60,000.
B. South has now the third most jobs.
C. -505000 is the change of job in all regions.
D. South-West region saw the second largest variation in jobs.
Choose the correct answer from the options given below :
Employment Trend Analysis: Evaluating Regional Job Data
This solution analyzes the provided employment data to determine the truthfulness of the given statements. We need to calculate new job totals and variations based on job gains/losses and previous job figures.
Data Summary and Unit Conversion
The table provides data in two units:
- Previous total job By region: in Lakhs (1 Lakh = 100,000)
- Latest JobLoss/Gain by regions: in thousands (1 Thousand = 1,000)
Calculations require consistent units, typically converting Lakhs and Thousands to standard numerical values.
Statement Analysis
Statement A: New number of jobs for South-West is 21,60,000.
Calculate the new job total for the South-West region:
- Previous Jobs (South-West): 23 Lakhs = $23 \times 100,000 = 2,300,000$
- Job Change (South-West): -140 Thousands = $-140 \times 1,000 = -140,000$
- New Jobs = Previous Jobs + Job Change $ \text{New Jobs}_{\text{South-West}} = 2,300,000 + (-140,000) = 2,160,000 $
Statement A is True.
Statement B: South has now the third most jobs.
Calculate the new job totals for all regions:
- North: $1,800,000 + 33,000 = 1,833,000$
- North-East: $1,400,000 + 70,000 = 1,470,000$
- North-West: $2,200,000 + 172,000 = 2,372,000$
- South: $2,400,000 + (-360,000) = 2,040,000$
- South-East: $1,600,000 + (-270,000) = 1,330,000$
- South-West: $2,300,000 + (-140,000) = 2,160,000$
Ordering the regions by their new job totals (highest first):
| Rank | Region | New Job Total |
|---|---|---|
| 1st | North-West | $2,372,000$ |
| 2nd | South-West | $2,160,000$ |
| 3rd | South | $2,040,000$ |
| 4th | North | $1,833,000$ |
| 5th | North-East | $1,470,000$ |
| 6th | South-East | $1,330,000$ |
The South region ranks 3rd in total jobs. Statement B is True.
Statement C: -505000 is the change of job in all regions.
Calculate the total change in jobs across all regions:
$ \text{Total Change} = (+33,000) + (+70,000) + (+172,000) + (-360,000) + (-270,000) + (-140,000) $ $ \text{Total Change} = 275,000 - 770,000 = -495,000 $The total change is -495,000, not -505,000. Statement C is False.
Statement D: South-West region saw the second largest variation in jobs.
Calculate the variation (absolute value of job change) for each region:
- North: $|+33,000| = 33,000$
- North-East: $|+70,000| = 70,000$
- North-West: $|+172,000| = 172,000$
- South: $|-360,000| = 360,000$
- South-East: $|-270,000| = 270,000$
- South-West: $|-140,000| = 140,000$
Ordering the regions by variation (largest first):
- South: $360,000$
- South-East: $270,000$
- North-West: $172,000$
- South-West: $140,000$
The South-West region had the fourth largest variation. The second largest variation was in the South-East region. Statement D is False.
Conclusion
Statements A and B are true. Therefore, the correct option is the one that includes both A and B.
Similar Questions
- Given below are two statements : one is labelled as Assertion (A) and the other is labelled as Reason (R).
Assertion (A) : If A and B are non-empty sets then $(A \cup B) - A = A \cap B^C$ is true.
Reason (R) : Venn diagrams help to prove the some set relations.
In the light of the above statements, choose the most appropriate answer from the options given below : - If $|A|=25$, $|B|=30$, $|C|=45$, $|A \cap B|=5$, $|B \cap C|=10$, $|A \cap C|=6$, $|A \cap B \cap C|=2$
then arrange the following in non-decreasing order.
A. $|A \cup B|$
B. $|B \cup C|$
C. $|A \cup B \cup C|$
D. $|C \cup A|$
E. $|A - B|$
Choose the correct answer from the options given below : Which of the following are true for the given chart ?
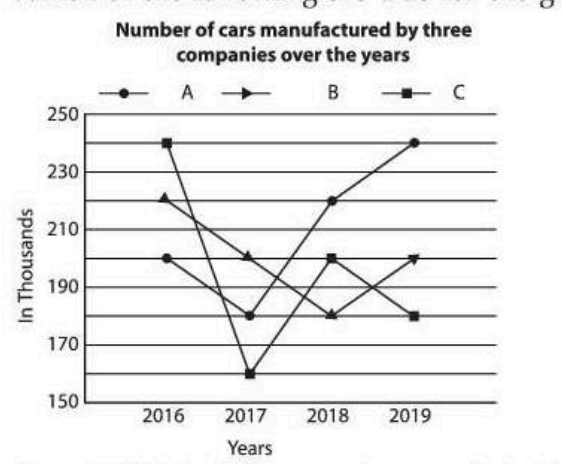
A. 40,000 is difference in manufacturing in C and B in year 2016-2017.
B. 20,000 is the difference between the total production of C and B in the given years.
C. 20% is decrease in car manufacturing by A from 2016 to 2017.
D. Approx. 11% increased in manufacturing by B from 2018-2019.
E. 2,10,000 is the average manufacturing of cars by A over the year.
Choose the correct answer from the options given below :The following chart is showing the number of cars passing in specific place in a morning 6 am to 12 Noon.
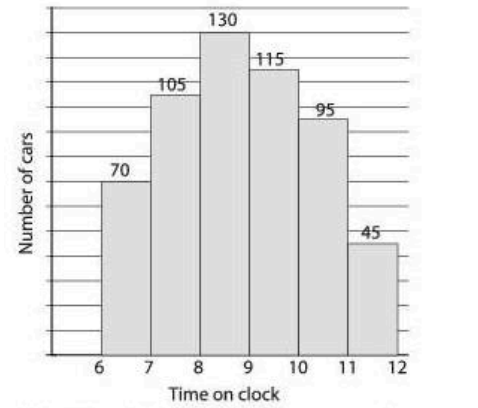
Which of the following are true on the basis of data given in chart ?
A. Highest number of cars are passing between 8 am - 9 am.
B. On an average, 90 cars are passing per hours.
C. 50% cars are passing higher in the interval 7 am to 8 am than 6 am to 7 am.
D. Less than half cars are passing 11 am - 12 noon than 8 am - 9 am.
E. Number of cars passing higher before 9 am than after 8 am.
Choose the correct answer from the options given below :The following figure represents for a company employing immigrants from different countries :
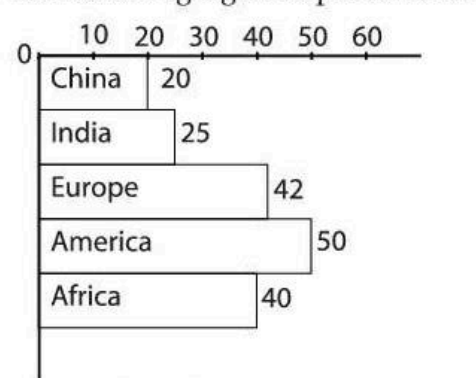
Which of the following is correct based on the given above chart ?
A. America and China have same number of immigrants.
B. China and Africa have same number of immigrants.
C. America has twice the number of immigrants than China.
D. Africa has twice the number of immigrants than China.
E. America has twice the number of immigrants than India.
Choose the correct answer from the options given below :Match List - I with List - II.
List - I List - II A. Apple, Orange, Fruits I. 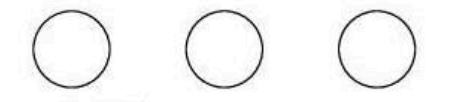
B. Son, Mother, Father II. 
C. Cat, Dog, Elephant III. 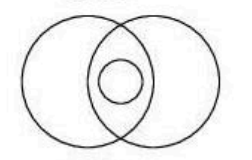
D. Player, Cricket, Ground IV. 
Choose the correct answer from the options given below :For the sets $A=\{0, 1, 2, 3\}$, $B=\{2, 3\}$, $C=\{1, 2, 4\}$, Match List - I with List - II.
List - I List - II A. $A - B$ I. $\{2\}$ B. $B \cap C$ II. $A$ C. $A \cup B$ III. $\{1, 2\}$ D. $A \cap C$ IV. $\{0, 1\}$ Choose the correct answer from the options given below :
Match List - I with List - II : On the basis of share of expenditure in given pie chart.
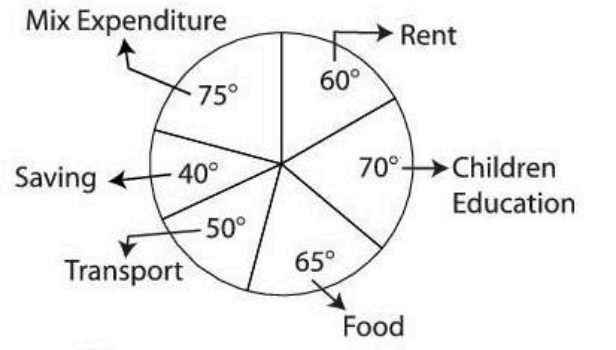
List - I List - II A. Percentage of Expenditure on Rent I. $11.11$ B. Percentage of Expenditure on Transport II. $13.89$ C. Percentage of Expenditure on Saving III. $16.67$ D. Percentage of Expenditure on Food IV. $18.06$ Choose the correct answer from the options given below :
- According to the author, the Indian people
- Indians do not do anything beneficial to society unless
Important Questions from Mixed Topic (CUET PG)
- Who was the founder of Bolshevik Communist party?
- What is the key guide to statecraft in the realist tradition?
- Chronologically arrange the events in the Cold War period.
A. Berlin Wall is constructed
B. Communist China joins the UN
C. Soviet invasion of Czechoslovakia
D. Berlin Blockade
Choose the correct answer from the options given below: Morgenthau's principles of political realism are:
A. Politics is rooted in permanent and unchanging human nature which is basically self centred, self-regarding and self-interested
B. Politics is an autonomous sphere of action and cannot therefore be reduced to morals
C. International Politics is an arena of conflicting self-interests
D. The ethics of international relations is situational ethics which is very different from private morality
Choose the correct answer from the options given below:Who among the following political thinkers consider the anarchical self help system to be a compelling factor for States to maximise their relative power positions?