
Consider a journey by a car represented by the graph given below in three parts A, B and C. The speed of the car in these parts is Va, Vb and Vc, respectively: Which one of the following is correct in this case?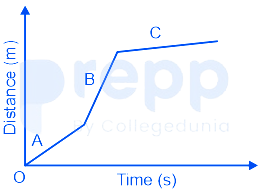
Vb > Va > Vc
Understanding Speed from a Distance-Time Graph
A distance-time graph is a powerful tool used to represent the motion of an object. In such a graph, the distance traveled by the object is plotted on the vertical axis (y-axis), and time taken is plotted on the horizontal axis (x-axis).
The speed of an object moving at a constant velocity is given by the change in distance divided by the change in time. On a distance-time graph, the speed is represented by the slope of the line segment during a particular interval.
The formula for slope (\(m\)) of a line passing through points \((x_1, y_1)\) and \((x_2, y_2)\) is given by:
\(m = \frac{y_2 - y_1}{x_2 - x_1}\)
In a distance-time graph, if distance is on the y-axis and time on the x-axis, the slope is:
\(\text{Slope} = \frac{\text{Change in Distance}}{\text{Change in Time}}\)
This is exactly the definition of speed. Therefore, the slope of the line segment in a distance-time graph represents the speed of the object during that time interval.
- A steeper slope indicates a higher speed.
- A less steep slope indicates a lower speed.
- A horizontal line indicates zero speed (the object is stationary).
Let's analyze the given graph which represents a car journey in three parts: A, B, and C. We need to compare the speeds \(V_a\), \(V_b\), and \(V_c\) in these respective parts.
Analyzing Each Part of the Car Journey
We will visually inspect the slope of the line segments in parts A, B, and C to determine the relative speeds.
-
Part A: The line segment A starts from the origin and moves upwards and to the right. It has a positive slope, indicating the car is moving away from the starting point at a constant speed \(V_a\).
-
Part B: The line segment B starts where A ends and continues upwards and to the right. Compared to segment A, segment B is noticeably steeper. This indicates a higher slope than A, meaning the car is moving at a higher speed \(V_b\) in part B.
-
Part C: The line segment C starts where B ends and continues upwards and to the right. Compared to segment B, segment C is much less steep. Compared to segment A, segment C is also less steep. This indicates a lower slope than both A and B, meaning the car is moving at a lower speed \(V_c\) in part C.
Comparing the Speeds \(V_a\), \(V_b\), and \(V_c\)
Based on our analysis of the slopes:
- The slope of B is the steepest.
- The slope of A is less steep than B but steeper than C.
- The slope of C is the least steep.
Since speed is represented by the slope in a distance-time graph, we can conclude:
\(\text{Slope of B} > \text{Slope of A} > \text{Slope of C}\)
Therefore, the speeds are related as:
\(V_b > V_a > V_c\)
Conclusion
Comparing this relationship with the given options, we find that the correct relation between the speeds in parts A, B, and C of the car journey is \(V_b > V_a > V_c\).
Revision Table: Distance-Time Graph Interpretation
| Feature on Graph | Represents | Interpretation for Motion |
|---|---|---|
| Slope of the line | Speed | Steeper slope = Higher speed Less steep slope = Lower speed Zero slope (horizontal) = Stationary |
| Straight line | Constant speed | Object moves at a steady rate |
| Curved line | Changing speed | Object is accelerating or decelerating |
| Slope becoming steeper | Increasing speed | Acceleration |
| Slope becoming less steep | Decreasing speed | Deceleration |
| Line returning towards time axis | Object returning to start point | Negative velocity (moving in opposite direction) |
Additional Information: Types of Motion Graphs
Besides distance-time graphs, velocity-time graphs and acceleration-time graphs are also commonly used to describe motion. Each type of graph provides different information about the motion of an object.
-
Velocity-Time Graphs:
- The slope represents acceleration.
- The area under the graph represents displacement.
-
Acceleration-Time Graphs:
- The area under the graph represents the change in velocity.
Understanding how to interpret the slope and area for each type of graph is crucial for analyzing motion.
Important Questions from Laws of Motion
Which of the following is correct?
I. The mass of an object is a measure of its inertia
II. In an isolated system the total momentum remains conserved
A 20.0 kg block is placed on a smooth horizontal table. A horizontal force of 12.0 Newton is applied to the block. The position of the block at 5.0 sec is
A subway train starts from rest at a station and accelerates at a rate of 3 ms-2 for 10s. It then runs at a constant speed for 20s and decelerates at 5 ms-2 unit it stops at the next station. The distance between the two stations is:
In a desert, a beetle's motion sends fast longitudinal pulses, vL = 150 ms-1, and slower transverse pulses, vS = 50 ms-1, along the sand's surface. The sand scorpion has eight legs; spread roughly in a circle of 5 cm diameter, intercepts the faster longitudinal pulses 4.0 ms earlier than the slower transverse pulse. The pray is located at a distance of:
- Why do passengers in a moving car tend to jerk forward when the brakes are suddenly applied?



