The figures P and Q represent schematic binary phase diagrams for solid-melt and subsolidus relations in temperature (T)-composition (X) space.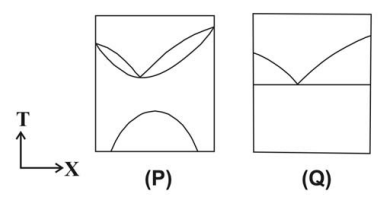
To determine which statement is correct regarding the presence of Solvus in the binary phase diagrams P and Q, let's first understand what Solvus is and how it appears in phase diagrams.
Solvus Line: In a phase diagram, a solvus line indicates the boundary between single-phase and two-phase regions. It represents the limit of solubility of one phase within another.
Now, let's analyze the given schematic binary phase diagrams P and Q shown below:
Based on the information:
- Diagram P shows a distinct curved boundary within the two-phase region in the temperature-composition space. This curve is indicative of the Solvus line, marking the limit of solid solubility.
- Diagram Q lacks such a boundary within the two-phase region, implying the absence of a Solvus line.
Based on the above observations, we conclude that Solvus occurs in P but not in Q.
The correct and most logical choice given the evidence is:
- Solvus occurs in P but not in Q
Important Questions from Igneous Petrology (Binary and Ternary Phase Diagrams)
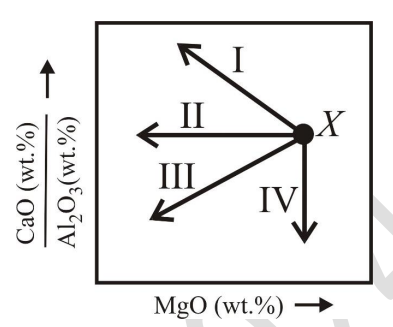
If 'X' represents the initial composition of a melt, which one of the trends indicated by arrows in the schematic diagram corresponds to the evolution of the residual melt composition during crystallization of diopside?
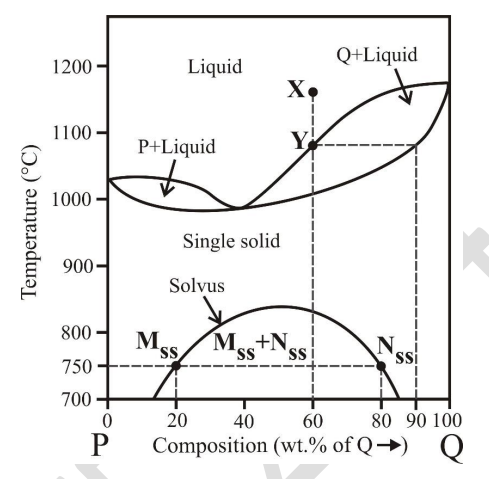
The diagram given below shows phase relations between components P and Q at 1 bar pressure. If ‘X' represents the initial liquid composition, which of the following statements is/are CORRECT during equilibrium crystallization?
- Choose the CORRECT statement regarding crystallization of a single feldspar of composition $Or_{50}Ab_{50}$ in the Albite-Orthoclase system.
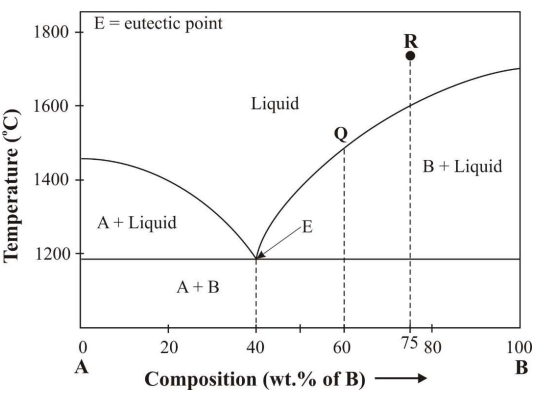
The following diagram shows phase relations in a system consisting of components A and B at 1 bar pressure. If the initial composition of liquid is R, during cooling and crystallization of magma, which of the following statement(s) is/are CORRECT?
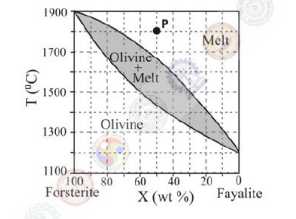
The given T-X diagram shows the phase relations in olivine solid solution at 1 bar pressure. If 'P' is the initial position of melt, the proportion of melt at $1500^\circ$C is __________ %.