
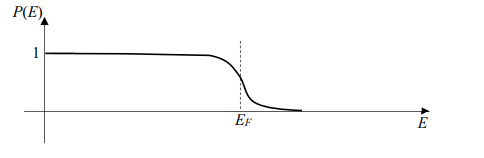
Occupation Probability at T = 0 K
The occupation probability P(E) of an energy state E describes the likelihood of finding an electron in that state.
According to the Fermi-Dirac distribution, at absolute zero temperature (T = 0 K), the behavior is as follows:
- Energy states with energy below the Fermi level (E < EF) are completely filled. Thus, the occupation probability is P(E) = 1.
- Energy states with energy above the Fermi level (E > EF) are completely empty. Thus, the occupation probability is P(E) = 0.
This results in a sharp step-function change in occupation probability precisely at the Fermi level (EF).
Analysis of BCS Type Superconductor Diagram
The diagram representing the occupation probability P(E) versus energy E at T = 0 K should exhibit this step-function characteristic.
The first diagram shows:
- A constant occupation probability of 1 for energies below a certain level (EF).
- A sudden drop to an occupation probability of 0 for energies above that level (EF).
This step-function behavior accurately represents the occupation probability of electron energy states at T = 0 K, consistent with the Fermi-Dirac distribution.
The provided correct answer corresponds to this diagram, showing the ideal occupation distribution at absolute zero temperature.
Important Questions from Superconductivity Meissner Effect BCS Theory
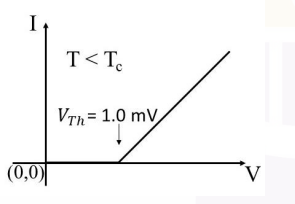
Consider a metal-superconductor junction connected to a dc voltage $V$. At $T < T_c$, where $T_c$ is the superconductor's transition temperature, the current $I$ versus $V$ behavior of this junction is shown schematically in the figure below. If the superconducting energy gap is $D \text{ meV}$. The value of $D$ (rounded off to one decimal place) is _____
- Which of the following option(s) is/are correct for a Type I superconductor?
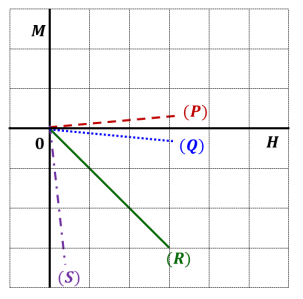
The figure schematically shows the $M$ (magnetization) - $H$ (magnetic field) plots for certain types of materials. Here $M$ and $H$ are plotted in the same scale and units. Which one of the following is the most appropriate combination?
- A material behaves as a superconductor below a critical temperature $T_c$ and as a normal conductor above $T_c$. A magnetic field $\vec{B} = B\hat{z}$ is applied when $T > T_c$. The material is then cooled below $T_c$ in the presence of $\vec{B}$. Which of the following figure represent the correct configuration of magnetic field lines?
- Amongst electrical resistivity ($\rho$), thermal conductivity ($\kappa$), specific heat ($C$), Young's modulus ($Y$), and magnetic susceptibility ($\chi$), which quantities show a sharp change at the superconducting transition temperature?


