
Aphids feed on both alfalfa and clover plants. A researcher collected and reared different genotypes of aphids from separate alfalfa and clover fields. He then measured the fecundity of both aphid groups when fed on each of the two host plants. The figure summarizes the performance of aphid groups originating from alfalfa (dashed) or clover (solid).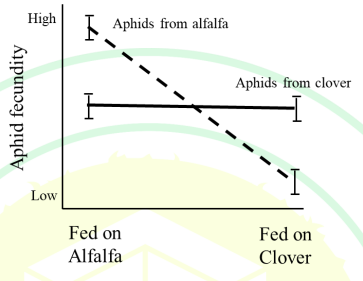
Which one or more of the following situations does the figure depict?
To understand which situation the figure depicts, we need to analyze the information provided and the implications of each option.
-
Aphids demonstrate a genotype by environment interaction:
- This interaction means that aphid genotypes respond differently to different environments. The graph shows that aphids originating from alfalfa have a higher fecundity on alfalfa than on clover, whereas the fecundity of aphids from clover does not change much between the two plants. This differing response to the environment indicates a genotype by environment interaction.
-
Aphids from clover fields are much less genetically variable than aphids from alfalfa fields:
- There is no specific evidence from the graph to support lower genetic variability in clover aphids. The graph illustrates performance, not genetic variability.
-
Aphids from clover fields are locally adapted to their original host:
- If this were true, we would expect aphids from clover to perform significantly better on clover than on alfalfa. However, the graph shows that their performance remains relatively consistent across both plants.
-
Aphids from clover fields show high plasticity:
- High plasticity would mean that clover aphids can adjust their fecundity significantly across environments. The graph does not indicate significant change for clover aphids between different host plants.
Conclusion: The figure depicts that "Aphids demonstrate a genotype by environment interaction," as it visually reflects how the genotype of aphids from different origins responds differently to the environmental factor of host plant type.
Important Questions from Natural selection
- Which one or more of the following conditions is/are necessary for the evolution of increased nectar production in an insect-pollinated plant via natural selection?
There are two species, X and Y, with abundances $x$ and $y$, respectively. Species X has growth rate $\alpha$, and species Y has growth rate $\beta$. Assume that the sum of the species abundances is constant over time, i.e., $x + y = 1$. Let $x$ and $y$ follow the rate equations:
$$\frac{dx}{dt} = \alpha x - \varphi x,$$
$$\frac{dy}{dt} = \beta y - \varphi y,$$ where $\varphi$ is the average species fitness.
Which one of the following options correctly represents the expression for $\varphi$?The figure illustrates the soil zinc tolerance of the grass species Anthoxanthum along a transect from inside a mine to the middle of a pasture outside the mine.
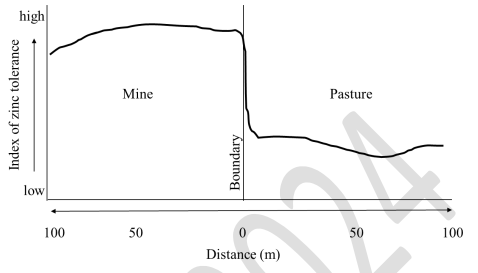
Which one or more of the following processes explain(s) the observed pattern of zinc tolerance in this grass species?A researcher estimates the relationship between reproductive success ($N$, number of offspring) and horn length ($H$, in cm) in a wild goat as
$N = 40 – 2.2H + 0.04H^2$
Horn length typically varies from 10 cm to 50 cm in this species. Which one of the following graphs correctly represents this relationship?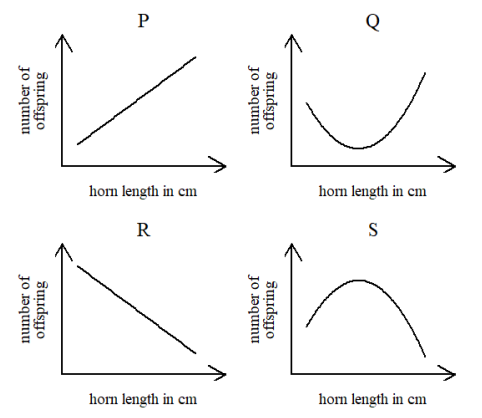
- A new food requesting behaviour has been observed in bonnet macaques in Bandipur National Park. The macaques extend their hand and make a cooing sound only towards humans, which effectively results in food given to them. If this behaviour is to increase in frequency in the population over time by the process of natural selection, which one or more of the options below is/are necessary condition(s)?


