
A researcher estimates the relationship between reproductive success ($N$, number of offspring) and horn length ($H$, in cm) in a wild goat as
$N = 40 – 2.2H + 0.04H^2$
Horn length typically varies from 10 cm to 50 cm in this species. Which one of the following graphs correctly represents this relationship?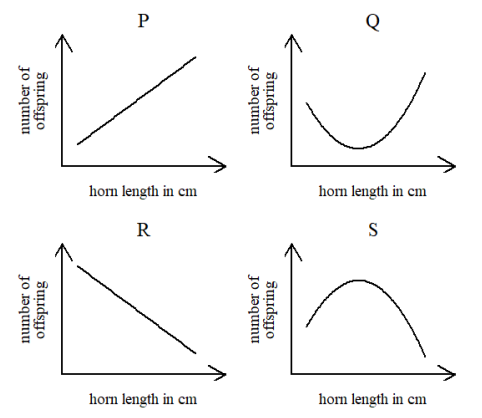
The relationship between reproductive success ($N$, number of offspring) and horn length ($H$, in cm) is given by the quadratic equation:
$$N = 40 - 2.2H + 0.04H^2$$
This is a quadratic function of the form $N = aH^2 + bH + c$, where $a = 0.04$ (positive), $b = -2.2$, and $c = 40$.
1. Determine the Shape of the Curve
Since the coefficient of the quadratic term ($a = 0.04$) is positive, the curve is a parabola that opens upwards. This means the function has a global minimum.
Graph Q (parabola opening upwards, showing a minimum) and Graph S (parabola opening downwards, showing a maximum) are the only possibilities for a quadratic relationship.
Based on the positive quadratic coefficient, Graph Q is the correct shape, representing a minimum number of offspring at an intermediate horn length.
2. Locate the Minimum (Vertex)
We calculate the horn length $H_{\min}$ at which the minimum reproductive success occurs:
$$H_{\min} = -\frac{b}{2a}$$ $$H_{\min} = -\frac{(-2.2)}{2 \cdot (0.04)} = \frac{2.2}{0.08} = 27.5 \text{ cm}$$
3. Check the Relevant Range
The horn length typically varies from $10 \text{ cm}$ to $50 \text{ cm}$. Since $H_{\min} = 27.5 \text{ cm}$ falls within this range, the full curve showing the minimum point should be visible in the graph if the axes cover this range.
Since the relationship is quadratic with a positive leading coefficient, the graph must be a parabola opening upwards, like **Graph Q**.
- Graph P: Linear positive relationship. (Incorrect)
- Graph R: Linear negative relationship. (Incorrect)
- Graph Q: Quadratic relationship opening upwards (Minimum). (Correct)
- Graph S: Quadratic relationship opening downwards (Maximum). (Incorrect)
The correct graph representing this relationship is Q.
Important Questions from Natural selection
Aphids feed on both alfalfa and clover plants. A researcher collected and reared different genotypes of aphids from separate alfalfa and clover fields. He then measured the fecundity of both aphid groups when fed on each of the two host plants. The figure summarizes the performance of aphid groups originating from alfalfa (dashed) or clover (solid).
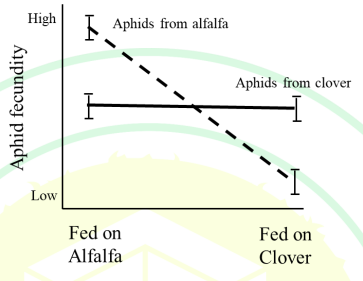
Which one or more of the following situations does the figure depict?- Which one or more of the following conditions is/are necessary for the evolution of increased nectar production in an insect-pollinated plant via natural selection?
There are two species, X and Y, with abundances $x$ and $y$, respectively. Species X has growth rate $\alpha$, and species Y has growth rate $\beta$. Assume that the sum of the species abundances is constant over time, i.e., $x + y = 1$. Let $x$ and $y$ follow the rate equations:
$$\frac{dx}{dt} = \alpha x - \varphi x,$$
$$\frac{dy}{dt} = \beta y - \varphi y,$$ where $\varphi$ is the average species fitness.
Which one of the following options correctly represents the expression for $\varphi$?The figure illustrates the soil zinc tolerance of the grass species Anthoxanthum along a transect from inside a mine to the middle of a pasture outside the mine.
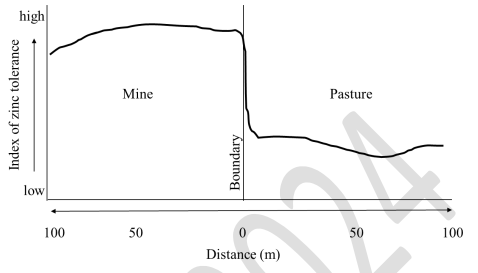
Which one or more of the following processes explain(s) the observed pattern of zinc tolerance in this grass species?- A new food requesting behaviour has been observed in bonnet macaques in Bandipur National Park. The macaques extend their hand and make a cooing sound only towards humans, which effectively results in food given to them. If this behaviour is to increase in frequency in the population over time by the process of natural selection, which one or more of the options below is/are necessary condition(s)?


