
Question
Which one of the given figures P, Q, R and S represents the graph of the following function?
$f(x) = | |x + 2| - |x - 1| |$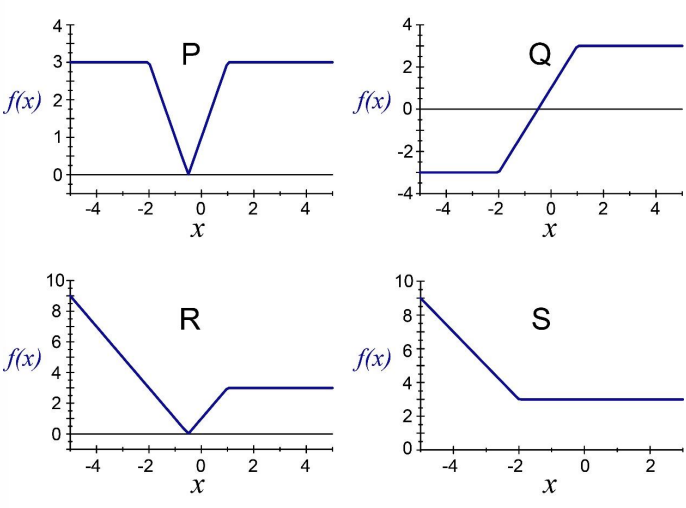
The correct answer is
P
To solve this problem, we need to understand the behavior of the function \(f(x) = ||x + 2| - |x - 1||\) and match it with one of the given graphs. Let's analyze the function step by step:
Step 1: Break Down the Absolute Value Expressions
- The function involves absolute values, which means it will have different expressions based on the sign of the expressions inside the absolute values.
- Consider the critical points where the expressions inside the absolute values change sign: \(x = -2\) and \(x = 1\).
Step 2: Evaluate the Function in Different Intervals
- \(x \leq -2\): Both \(x + 2\) and \(x - 1\) are negative.
- The function simplifies to: \(f(x) = |-(x + 2) - (-(x - 1))| = |-x - 2 + x - 1| = |(-3)| = 3\).
- \(-2 \lt x \leq 1\): \(x + 2\) is positive, \(x - 1\) is negative.
- The function simplifies to: \(f(x) = |(x + 2) - (-(x - 1))| = |x + 2 + x - 1| = |2x + 1|\).
- \(x \gt 1\): Both \(x + 2\) and \(x - 1\) are positive.
- The function simplifies to: \(f(x) = |(x + 2) - (x - 1)| = |x + 2 - x + 1| = |3| = 3\).
Step 3: Sketch the Graph
- In the intervals \(x \leq -2\) and \(x \gt 1\), the function is constant with a value of 3.
- In the interval \(-2 \lt x \leq 1\), the function is a linear function \(|2x + 1|\), which forms a 'V' shape at \(x = -\frac{1}{2}\).
Conclusion
- Based on the analysis above, graph "P" displays constant values of 3 for \(x \leq -2\) and \(x \gt 1\), and a 'V' shape between \(x = -2\) and \(x = 1\).
Thus, the correct graph that represents the function is graph "P".
Was this answer helpful?
Important Questions from Absolute Value Function
- If $|-2X + 9| = 3$ then the possible value of $|-X| – X^2$ would be:
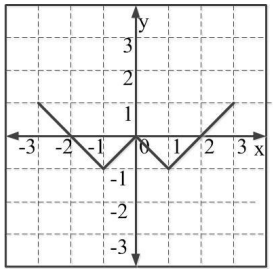
Which of the following functions describe the graph shown in the below figure?
- If $|9y-6|=3$, then $y^2 -4y/3$ is ________
- If $|4X - 7| = 5$ then the values of $2 |X| – | – X|$ is:
- Which one of the following plots represents $f(x) = -\frac{|x|}{x}$, where x is a non-zero real number?
Note: The figures shown are representative.
Need Expert Advice?


