
Note: The figures shown are representative.
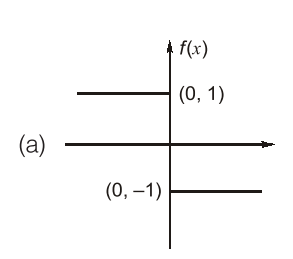
Function Analysis for $f(x) = -\frac{|x|}{x}$
The function is defined for non-zero real numbers ($x \neq 0$). We need to analyze its behavior for positive and negative values of $x$.
Analyzing Cases
- Case 1: $x > 0$ (Positive x)
When $x$ is positive, the absolute value $|x|$ is equal to $x$.
Therefore, the function becomes: $f(x) = -\frac{x}{x} = -1$. This means for all positive $x$, the function value is constant at $-1$. - Case 2: $x < 0$ (Negative x)
When $x$ is negative, the absolute value $|x|$ is equal to $-x$.
Therefore, the function becomes: $f(x) = -\frac{-x}{x} = -(-1) = 1$. This means for all negative $x$, the function value is constant at $1$.
Interpreting the Plot
The function $f(x)$ can be summarized as a piecewise function:
$f(x) = \begin{cases} 1 & \text{if } x < 0 \\ -1 & \text{if } x > 0 \end{cases}$This describes a graph consisting of two horizontal line segments:
- A horizontal line at $y = 1$ for all negative values of $x$.
- A horizontal line at $y = -1$ for all positive values of $x$.
Since $x$ cannot be zero, there should be open circles at the points $(0, 1)$ and $(0, -1)$ on the graph.
Identifying the Correct Plot
We need to find the plot that matches this description. Let's examine the options:
- Option 1 shows a line $y=1$ for $x < 0$ and $y=-1$ for $x > 0$. This matches our analysis.
- Option 2 shows the opposite: $y=-1$ for $x < 0$ and $y=1$ for $x > 0$. Incorrect.
- Options 3 and 4 show lines passing through the origin with positive and negative slopes, respectively. Incorrect.
Therefore, the plot representing the function $f(x) = -\frac{|x|}{x}$ is the one shown in Option 1.
Important Questions from Absolute Value Function
- If $|-2X + 9| = 3$ then the possible value of $|-X| – X^2$ would be:
Which one of the given figures P, Q, R and S represents the graph of the following function?
$f(x) = | |x + 2| - |x - 1| |$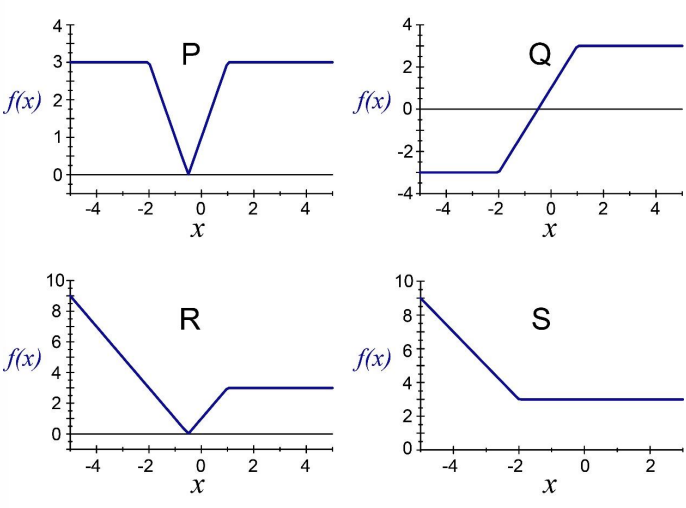
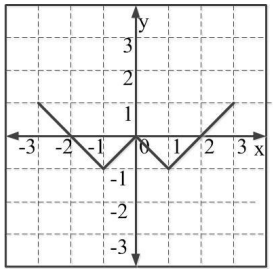
Which of the following functions describe the graph shown in the below figure?
- If $|9y-6|=3$, then $y^2 -4y/3$ is ________
- If $|4X - 7| = 5$ then the values of $2 |X| – | – X|$ is:


