
Question
Which of the following functions describe the graph shown in the below figure?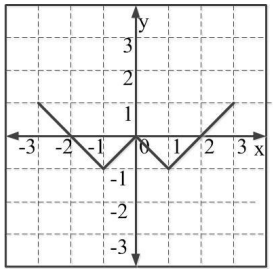
The correct answer is
$y = ||x| - 1| - 1$
Let's analyze the given graph to determine which function describes it correctly. The graph shows a V-shape which suggests the use of absolute values.
The correct function given is y = ||x| - 1| - 1. Let's break down this function:
- The innermost expression |x| reflects the values of x to the positive side, creating a symmetric shape around the y-axis.
- Then, |x| - 1 shifts the graph downward by 1 unit.
- The entire expression ||x| - 1| ensures that any negative values resulting from |x| - 1 are flipped upwards, maintaining a V-shape.
- Finally, ||x| - 1| - 1 shifts the entire graph down by another 1 unit.
Now, let's consider why the other options are incorrect:
- y = ||x| + 1| - 2: Shifts upward, doesn't match the observed V-position.
- y = ||x| + 1| - 1: Again shifts upward.
- y = ||x - 1| - 1|: This shifts horizontally which doesn't fit the described graph's symmetry.
Therefore, the correct function describing the graph is y = ||x| - 1| - 1.
Was this answer helpful?
Important Questions from Absolute Value Function
- If $|-2X + 9| = 3$ then the possible value of $|-X| – X^2$ would be:
Which one of the given figures P, Q, R and S represents the graph of the following function?
$f(x) = | |x + 2| - |x - 1| |$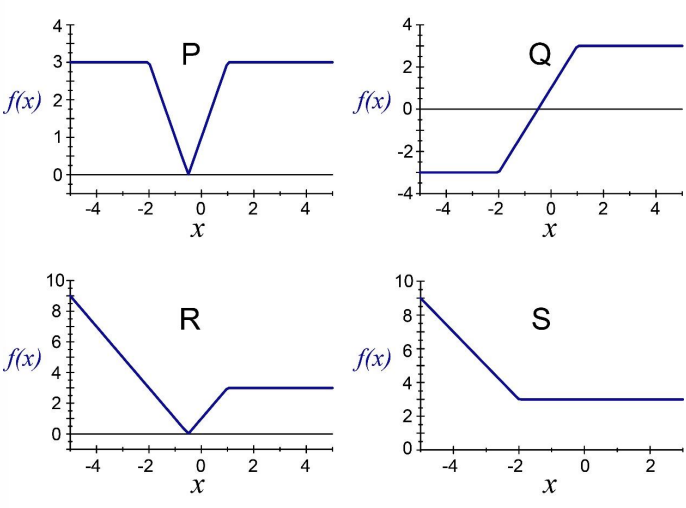
- If $|9y-6|=3$, then $y^2 -4y/3$ is ________
- If $|4X - 7| = 5$ then the values of $2 |X| – | – X|$ is:
- Which one of the following plots represents $f(x) = -\frac{|x|}{x}$, where x is a non-zero real number?
Note: The figures shown are representative.
Need Expert Advice?


