
Understanding Bioprocess Product Formation Kinetics
The question asks to identify the kinetic model for non-growth associated product formation in bioprocesses. This type of product formation occurs independently of the cell growth rate.
Analyzing Non-Growth Associated Kinetics
The rate of product formation is generally expressed as:
\(\frac{dP}{dt} = q_p X\)
Where:
- \(P\) is the product concentration
- \(t\) is time
- \(X\) is the viable cell concentration
- \(q_p\) is the specific product formation rate
For non-growth associated kinetics, the specific productivity \(q_p\) is assumed to be constant over time, often denoted as \(k_p\). Therefore, the rate equation simplifies to:
\(\frac{dP}{dt} = k_p X\)
This implies:
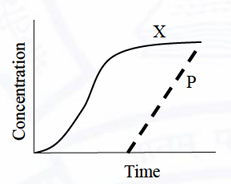
- If the cell concentration \(X\) is constant (e.g., during the stationary phase of growth), the product formation rate \(\frac{dP}{dt}\) is also constant.
- A constant formation rate leads to a linear increase in product concentration ($P$) over time ($t$).
Evaluating the Graphical Options
The correct graphical representation should demonstrate this linear relationship between $P$ and $t$, particularly during the phase when $X$ is constant.
- Option 1 shows P increasing exponentially with t, which typically represents growth-associated production.
- Option 2 shows P increasing linearly with t. However, the accompanying plot for X vs t shows exponential growth initially. A constant rate of P formation (\(dP/dt\)) is inconsistent with exponential cell growth ($X$) according to the equation \(\frac{dP}{dt} = k_p X\).
- Option 3 presents a graph where P increases linearly with time ($t$) during the specific period when the cell concentration ($X$) has reached a plateau (constant). This is the characteristic behavior of non-growth associated product formation, matching the condition \(\frac{dP}{dt} = k_p X\) with $X$ being constant.
- Option 4 illustrates product formation followed by a decrease, possibly due to product degradation, which doesn't represent the standard non-growth associated kinetics.
Conclusion on Kinetics Representation
Option 3 is the correct representation because it clearly shows the linear accumulation of product ($P$) over time ($t$) during the stationary phase of biomass ($X$), which is the hallmark of non-growth associated product formation.
Important Questions from Kinetics of Cell Growth Substrate Utilization and Product Formation
If the rate at which $E. coli$ divides is $0.5 \text{ h}^{-1}$, then its doubling time is _______________ h.
- Which of the following factors can affect the growth of a microbial culture in a batch cultivation process?
Let $y(t)$ be a bacterial population whose growth is given by
$ \frac{dy}{dt} = \lambda(y + 2) $
where $ \lambda $ is the growth rate constant. If $y(0) = 1$ and $y(1) = 4$, then the value of $ \lambda $ is
If the doubling time of a bacterial population is 3 hours, then its average specific growth rate during this period is _________ $h^{-1}$.
(Round off to two decimal places)
- A microorganism is grown in a batch culture using glucose as a carbon source. The apparent growth yield is $0.5 \frac{\text{g biomass}}{\text{g substrate}}$. The initial concentrations of biomass and substrate are $2 \text{ g L}^{-1}$ and $200 \text{ g L}^{-1}$, respectively. Assuming that there is no endogenous metabolism, the maximum biomass concentration that can be achieved is ________ $\text{g L}^{-1}$.


