
Which of the following Venn diagrams represents the relationship between Lions, Deers and Carnivores?

Lions, Deers, Carnivores Relationship Logic
To determine the correct Venn diagram, we first need to understand the relationship between Lions, Deers, and Carnivores:
- Carnivores are animals that primarily eat meat.
- Lions are a species of wild cat known for hunting and eating meat. Therefore, all Lions are Carnivores.
- Deers are herbivores, meaning they eat plants. They do not eat meat and are not Carnivores.
Venn Diagram Representation Explained
Based on the relationships:
- The set representing Carnivores is the encompassing category.
- The set representing Lions must be entirely contained within the Carnivores set, as every Lion is a Carnivore.
- The set representing Deers must be completely separate from the Carnivores set, as Deers are herbivores. It must also be separate from the Lions set.
The correct Venn diagram will show one circle (Lions) completely inside another circle (Carnivores), and a third circle (Deers) completely outside both.
Identifying the Correct Venn Diagram (Option D)
Option D depicts this exact relationship: a set for Lions fully enclosed within the set for Carnivores, with the set for Deers existing independently outside of these two.
The image associated with Option D correctly represents that all Lions are Carnivores, and Deers belong to neither category and have a distinct classification.
Important Questions from Venn Diagram Problems
In a group of 73 friends, 14 friends go to Gym and Karate classes both, whereas 7 friends neither go to Gym class nor to Karate class. If a total of 36 friends go to Gym class, then how many friends go to only Karate class?
In an examination 20% students failed in Mathematics and 15% failed in English. If 10% failed in both and those who passed in both numbered 300, then the total number of students who appeared in the examination was
In the following diagram, the 'circle' stands for 'soldiers', the 'square' stands for 'Indians', and the 'triangle' stands for 'singers'. The numbers given in the different segments represent persons belonging to that category.
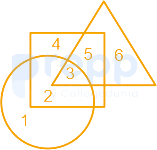
Which category is represented by the number '5'?
- In the following diagram, the circle stands for 'policemen', the square stands for 'sportspersons' and the 'triangle' stands for 'tax-payers' the numbers given in the different segments represent the number of persons in that category.
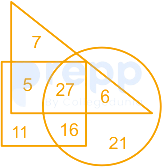
How many policemen are tax-payers but are NOT sportspersons?
Which of the following indicates 'Some hard workers are smart workers'?


