
Venn Diagram: Relationship Between Squares, Quadrilaterals & Geometrical Figures
This question asks to identify the correct Venn diagram representing the relationship between three sets: squares, quadrilaterals, and geometrical figures.
Analyzing Geometric Relationships
To solve this, we need to understand how these geometric terms relate to each other:
- Geometrical Figures: This is the broadest category, encompassing all shapes and forms studied in geometry.
- Quadrilaterals: These are specific geometrical figures defined as polygons with exactly four sides. Therefore, all quadrilaterals are geometrical figures.
- Squares: A square is a specific type of quadrilateral characterized by four equal sides and four right angles. Thus, all squares are quadrilaterals.
This establishes a clear subset relationship:
- Squares are a subset of Quadrilaterals (Squares ⊂ Quadrilaterals).
- Quadrilaterals are a subset of Geometrical Figures (Quadrilaterals ⊂ Geometrical Figures).
- Combining these, Squares are also a subset of Geometrical Figures (Squares ⊂ Geometrical Figures).
Venn Diagram Representation
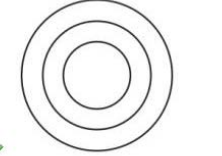
A Venn diagram uses circles (or other shapes) to show logical relationships between sets. For nested subsets like this, the diagram should show concentric circles, where each inner circle is entirely contained within the next outer circle.
- The innermost circle should represent the most specific set: Squares.
- The middle circle should represent the set that contains squares but is more general: Quadrilaterals.
- The outermost circle should represent the most general set that includes quadrilaterals: Geometrical Figures.
Identifying the Correct Diagram
Based on the subset relationship (Squares ⊂ Quadrilaterals ⊂ Geometrical Figures), the correct Venn diagram must show three nested circles in this order.
Option 1 displays this exact nested structure, accurately representing that all squares are quadrilaterals, and all quadrilaterals are geometrical figures.
The image corresponding to Option 1 is:
Similar Questions
Select the Venn diagram that best illustrates the relationship between the following classes.
Trees, Grass, Bamboo
In the following figure, the square represents dieticians, the triangle represents botanists, the circle represents psychologists and the rectangle represents Indians. Which set of letters represents the psychologists who are also botanists?
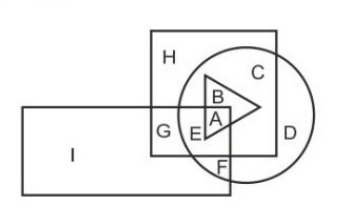
In the following figure, the square represents dieticians, the triangle represents botanists, the circle represents psychologists and the rectangle represents Indians. Which set of letters represents the psychologists who are also botanists?
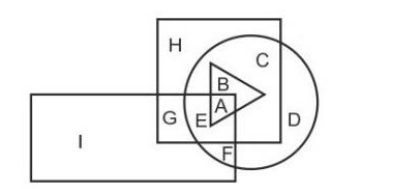
In the following figure, square represents Dieticians, triangle represents Botanists, circle represents Psychologists and rectangle represents Indians. Which set of letters represents Psychologists who are Botanists?
Important Questions from Venn Diagrams
How many people play either only volleyball or only chess as per the given Venn diagram?
Study the given Venn diagram and answer the question that follows.
How many women are either smart or brave or both?
How many people play either only volleyball or only chess as per the given Venn diagram?
Study the given Venn diagram and answer the question that follows.
How many women are either smart or brave or both?
How many people play either only volleyball or only chess as per the given Venn diagram?



