
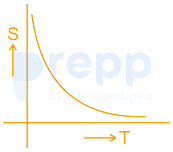
Which of the following graph correctly represents the variation of resistivity 's' with temperature 'T' for a semiconductor material ?
Understanding how the electrical resistivity of materials changes with temperature is fundamental in solid-state physics. This question asks about the specific behavior of semiconductor materials.
Semiconductor Resistivity and Temperature Relationship
Semiconductors like silicon or germanium have electrical properties that are significantly different from metals and insulators, especially in how they respond to temperature changes.
- In a semiconductor, charge carriers are primarily electrons in the conduction band and holes in the valence band.
- At very low temperatures, a pure (intrinsic) semiconductor behaves almost like an insulator because there are very few free charge carriers.
- As the temperature increases, thermal energy breaks covalent bonds, generating more electron-hole pairs. This process is called thermal generation.
- The number of free charge carriers (electrons and holes) increases significantly and rapidly with rising temperature.
- Electrical conductivity ($\sigma$) in a semiconductor is directly proportional to the number of free charge carriers. It is also related to their mobility ($\mu$). The conductivity is given by $\sigma = n e \mu_n + p e \mu_p$, where $n$ and $p$ are the concentrations of electrons and holes, $e$ is the elementary charge, and $\mu_n$ and $\mu_p$ are their respective mobilities.
- The resistivity ($\rho$) is the inverse of conductivity ($\rho = 1/\sigma$).
- Since the concentration of charge carriers ($n$ and $p$) increases exponentially with temperature in intrinsic semiconductors, the conductivity increases exponentially, and consequently, the resistivity decreases exponentially with increasing temperature. While mobility also changes with temperature, the change in carrier concentration is the dominant factor.
Analyzing the Graphs for Semiconductor Resistivity Variation
Let's examine the given graphs representing the variation of resistivity 's' (used here likely representing $\rho$) with temperature 'T'.
- Graph 1: Shows resistivity increasing with temperature. This behavior is typical of metals, where increasing temperature causes increased lattice vibrations, hindering electron flow and increasing resistance/resistivity. This is not characteristic of a semiconductor.
- Graph 2: Shows resistivity decreasing linearly with temperature. While semiconductor resistivity decreases with temperature, the relationship is not typically linear; it is closer to an exponential decrease due to the exponential increase in carrier concentration.
- Graph 3: Shows resistivity decreasing significantly and non-linearly (specifically, dropping off rapidly) as temperature increases. This curve shape correctly depicts the behavior of a semiconductor, where the exponential increase in charge carriers leads to a sharp decrease in resistivity with rising temperature.
- Graph 4: Shows resistivity increasing non-linearly with temperature. Again, this contradicts the fundamental behavior of semiconductors where resistivity decreases with temperature.
Therefore, the graph that correctly represents the variation of resistivity 's' with temperature 'T' for a semiconductor material is the one showing a sharp decrease in resistivity as temperature increases.
Conclusion
Based on the analysis of semiconductor properties and the graphical representations, the graph showing resistivity decreasing significantly with increasing temperature is the correct one for a semiconductor material. This corresponds to Graph 3.
| Material Type | Resistivity vs. Temperature | Typical Graph Shape |
|---|---|---|
| Metal | Increases with temperature (due to scattering) | Generally increasing (linear or slightly curved upwards) |
| Semiconductor | Decreases significantly with temperature (due to increased carrier concentration) | Decreasing rapidly (exponential-like) |
| Insulator | Very high resistivity, typically decreases with temperature but remains very high | Similar trend to semiconductors but at a much higher scale |
Revision Table: Semiconductor Properties
| Property | Behavior with Increasing Temperature (Semiconductor) | Reason |
|---|---|---|
| Charge Carrier Concentration | Increases significantly | Thermal energy breaks covalent bonds, generating electron-hole pairs |
| Conductivity ($\sigma$) | Increases significantly | Directly proportional to carrier concentration ($\sigma = 1/\rho$) |
| Resistivity ($\rho$) | Decreases significantly | Inverse of conductivity ($\rho = 1/\sigma$) |
Additional Information on Semiconductor Behavior
The exact variation of resistivity with temperature can also depend on whether the semiconductor is intrinsic (pure) or extrinsic (doped).
- Intrinsic Semiconductors: The carrier concentration depends purely on thermal generation. The resistivity decreases exponentially with temperature.
- Extrinsic Semiconductors: At lower temperatures, the conductivity is dominated by carriers from dopant atoms. As temperature increases, more dopant atoms are ionized, initially increasing conductivity slightly. At higher temperatures, intrinsic behavior dominates as thermal generation of electron-hole pairs becomes significant, and resistivity decreases rapidly, similar to an intrinsic semiconductor. The graphs usually depict the overall behavior, often dominated by the intrinsic range at higher temperatures shown.
- The relationship between intrinsic carrier concentration ($n_i$) and temperature is approximately given by $n_i \propto T^{3/2} e^{-E_g / 2kT}$, where $E_g$ is the band gap energy and $k$ is Boltzmann's constant. The exponential term $e^{-E_g / 2kT}$ causes the carrier concentration, and thus conductivity, to increase very rapidly with temperature, leading to the sharp decrease in resistivity shown in the correct graph.
Important Questions from Resistivity of Various Materials
- The resistivity of a conductor depends on the _______.
- Identify the conductor having the lowest resistivity.
- Identify the conductor having the highest resistivity.
- Identify the conductor having the lowest resistivity.
- Identify the conductor having the highest resistivity.


