The following table shows the number of employees of five companies A-E who prefer their own vehicle to reach office and percentage (%) of employees who prefer Metro and Bus to reach office. There are only three modes of transport as mentioned. Based on the data in the table, answer the questions that follow. Company wise Distribution of Employees Preferring Modes of TransportCompany Number of Employees who prefer their own Vehicles Number of Employees who prefer Metro Number of Employees who prefer Bus A 184 68% 24% B 78 60% 35% C 384 55% 30% D 182 70% 16% E 220 72.5% 15%
What is the total number of employees who prefer travelling by Metro from A, B and C?
3908
Count:
The metro is giving priority to the employees here;
A = (68 × 184) ÷ 8 = 1564
B = (60 × 78) ÷ 5 = 936
C = (55 × 384) ÷ 15 = 1408
The desired total number = 1564 + 936 + 1408 = 3908
∴ The total number of employees who prefer to travel by metro from A, B, and C is 3908.
Important Questions from Tabulation
- An object is placed beyond the centre of curvature (C) of a concave mirror. The image formed will be now:
Directions:
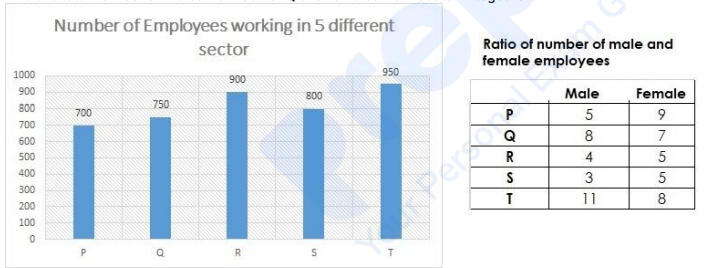
Using the data from the graph answer the question below:
Find the total number of males from sector P and females from sector R together.
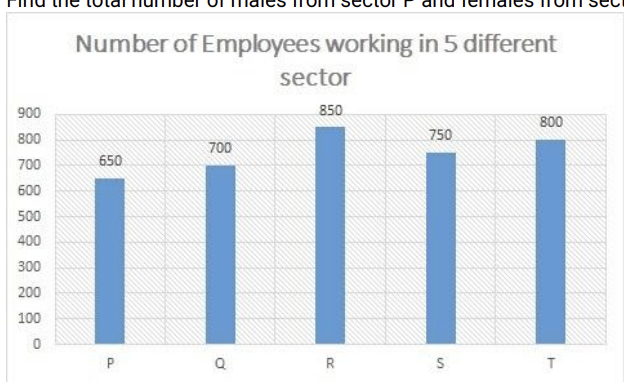
Ratio of number of male and female employees
Male Female P 6 7 Q 5 9 R 9 8 S 7 8 T 3 5 Directions:
Using the data from the graph answer the question below:
Number of Employees working in 5 different sector:
Find the number of males from sector Q.
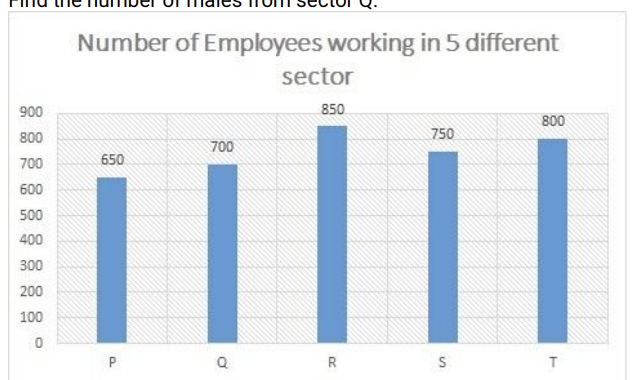
Ratio of number of male and female employees:
Male Female P 6 7 Q 5 9 R 9 8 S 7 8 T 3 5 Directions:
Using the data from the graph answer the question below:
Find the ratio between number of males from the sector T to number of females from the sector S.
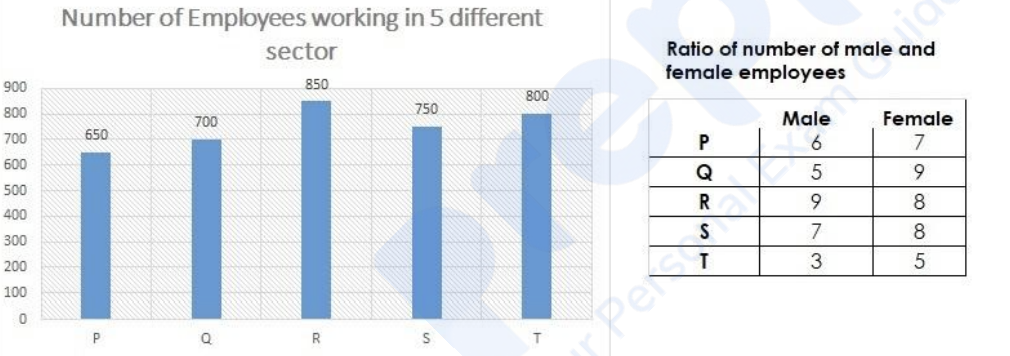
Directions:
Using the data from the graph answer the question below:
Find the total number of males from sector Q and females from sector P together.