The following table shows the number of Mobile Phones sold by five different sellers. A-E on seven different days (Monday to Sunday) in a week. Based on the data in the table, answer the questions. Seller-wise Sale of Mobile Phones Seller Number of Mobile Phones sold on Monday Tuesday Wednesday Thursday Friday Saturday Sunday A 80 90 96 56 100 48 40 B 180 184 54 24 32 196 52 C 160 72 60 26 56 124 94 D 120 92 24 128 104 68 152 E 96 36 116 138 140 20 30
What is the average of the sale of Mobile Phones by B on Wednesday, E on Sunday, and D on Monday?
68
B sold 54 phones on Wednesday, E sold 30 phones on Sunday, and
D sold 120 phones on Monday.
The desired average (54 + 30 + 120)/3 = 68.
Therefore, the correct answer is 68.
Important Questions from Tabulation
- An object is placed beyond the centre of curvature (C) of a concave mirror. The image formed will be now:
Directions:
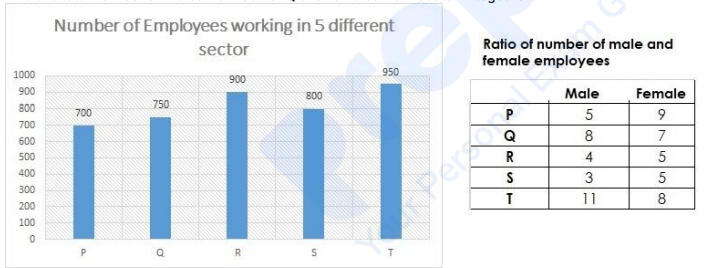
Using the data from the graph answer the question below:
Find the total number of males from sector P and females from sector R together.
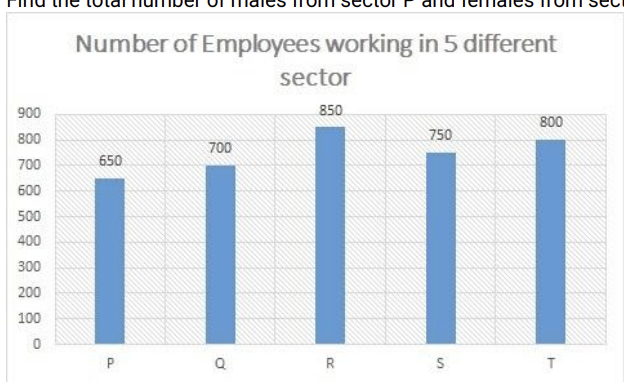
Ratio of number of male and female employees
Male Female P 6 7 Q 5 9 R 9 8 S 7 8 T 3 5 Directions:
Using the data from the graph answer the question below:
Number of Employees working in 5 different sector:
Find the number of males from sector Q.
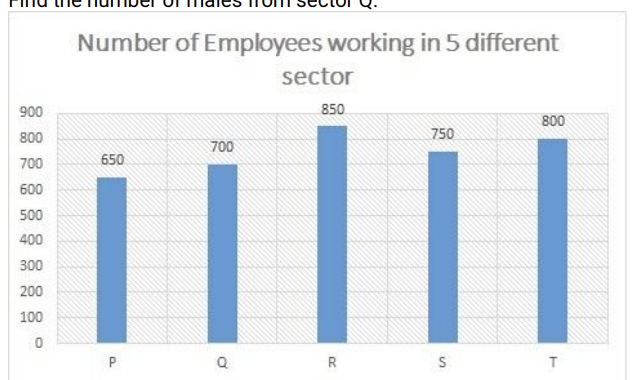
Ratio of number of male and female employees:
Male Female P 6 7 Q 5 9 R 9 8 S 7 8 T 3 5 Directions:
Using the data from the graph answer the question below:
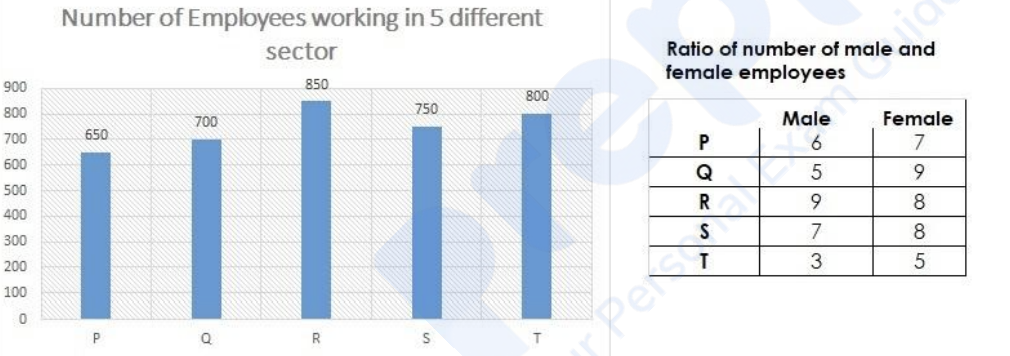
Find the ratio between number of males from the sector T to number of females from the sector S.
Directions:
Using the data from the graph answer the question below:
Find the total number of males from sector Q and females from sector P together.