The following table shows the number of Tourists who visited six different cities namely, Shimla,
Jaipur, Delhi, Agra, Goa and Manali by using five different modes of transport namely, Air, Bike,
Train, Bus, and Car in a given month of 2024. Based on the data in the table, answer the questions
that follow.
City-wise Transportation Details of Tourists
Number of Tourists City Mode of Transport Used Air Bike Train Bus Car Shimla 348 382 376 344 384 Jaipur 364 374 332 356 360 Delhi 296 362 388 326 312 Agra 296 340 370 284 264 Goa 366 298 318 310 298 Manali 348 284 326 316 336
Let's determine by what percentage the total number of tourists who visited Shimla is more than those who visited Manali using all five modes of transport. Below is the step-by-step calculation:
- First, calculate the total number of tourists who visited Shimla using all five modes of transport:
| Mode of Transport | Air | Bike | Train | Bus | Car |
| Tourists to Shimla | 348 | 382 | 376 | 344 | 384 |
Calculation for Shimla:
\(348 + 382 + 376 + 344 + 384 = 1834\)
- Next, compute the total number of tourists who visited Manali using all five modes of transport:
| Mode of Transport | Air | Bike | Train | Bus | Car |
| Tourists to Manali | 348 | 284 | 326 | 316 | 336 |
Calculation for Manali:
\(348 + 284 + 326 + 316 + 336 = 1610\)
- Find the difference in the number of tourists between Shimla and Manali:
\(1834 - 1610 = 224\)
- Calculate the percentage increase of tourists in Shimla compared to Manali:
Percentage Increase = \(\left(\frac{224}{1610}\right) \times 100 = 13.91\%\)
Thus, the total number of tourists who visited Shimla using all five modes of transport is approximately 13.91% more than those who visited Manali.
The correct answer is: 13.91%
Important Questions from Tabulation
- An object is placed beyond the centre of curvature (C) of a concave mirror. The image formed will be now:
Directions:
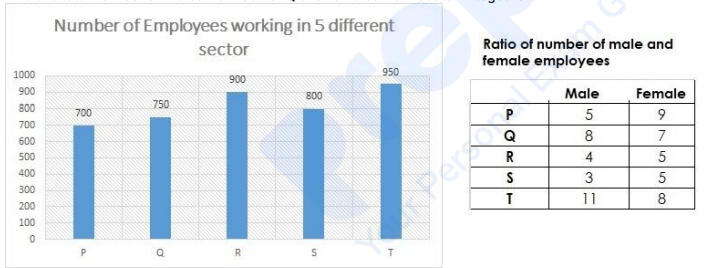
Using the data from the graph answer the question below:
Find the total number of males from sector P and females from sector R together.
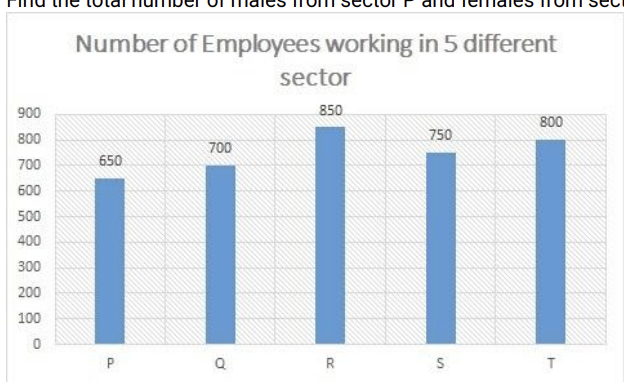
Ratio of number of male and female employees
Male Female P 6 7 Q 5 9 R 9 8 S 7 8 T 3 5 Directions:
Using the data from the graph answer the question below:
Number of Employees working in 5 different sector:
Find the number of males from sector Q.
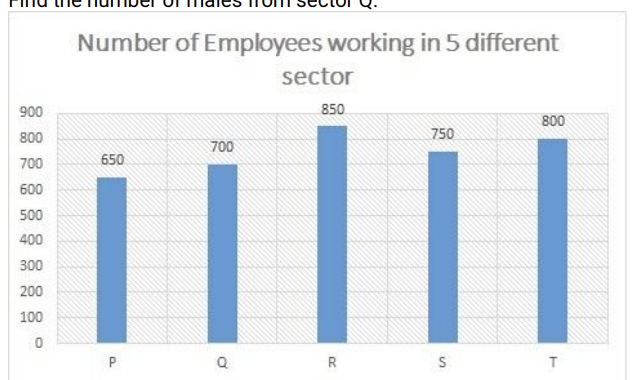
Ratio of number of male and female employees:
Male Female P 6 7 Q 5 9 R 9 8 S 7 8 T 3 5 Directions:
Using the data from the graph answer the question below:
Find the ratio between number of males from the sector T to number of females from the sector S.
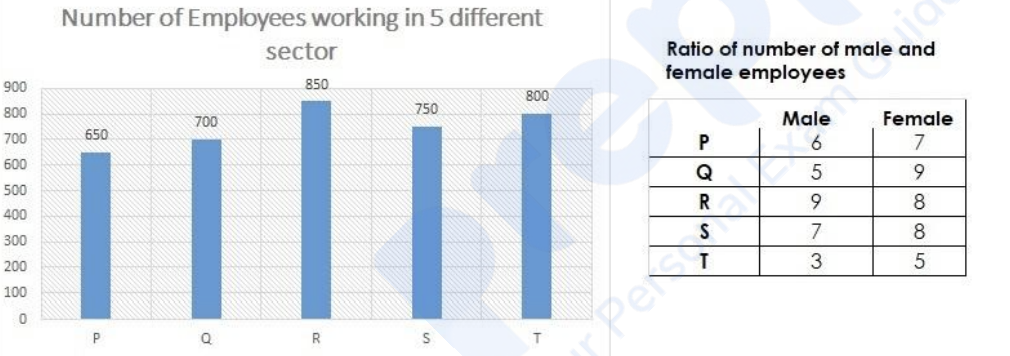
Directions:
Using the data from the graph answer the question below:
Find the total number of males from sector Q and females from sector P together.