The table given below shows the cost price and selling price of 5 different articles. What is the ratio of total cost price to total selling price of all articles?Article Cost price Selling price A 500 600 B 700 750 C 600 800 D 400 700 E 300 800
50 ∶ 73
Understanding the Question: Ratio of Total Cost Price to Total Selling Price
The question asks us to find the ratio of the combined cost price of all 5 articles to the combined selling price of all 5 articles. We are given a table containing the cost price and selling price for each individual article.
| Article | Cost Price (CP) | Selling Price (SP) |
|---|---|---|
| A | 500 | 600 |
| B | 700 | 750 |
| C | 600 | 800 |
| D | 400 | 700 |
| E | 300 | 800 |
Calculating Total Cost Price (Total CP)
To find the total cost price of all articles, we need to sum up the cost prices of article A, B, C, D, and E.
Total CP = CP(A) + CP(B) + CP(C) + CP(D) + CP(E)
Let's add the values from the table:
\(\text{Total CP} = 500 + 700 + 600 + 400 + 300\)
\(\text{Total CP} = 1200 + 600 + 400 + 300\)
\(\text{Total CP} = 1800 + 400 + 300\)
\(\text{Total CP} = 2200 + 300\)
\(\text{Total CP} = 2500\)
The total cost price for all 5 articles is 2500.
Calculating Total Selling Price (Total SP)
Next, we find the total selling price by summing the selling prices of article A, B, C, D, and E.
Total SP = SP(A) + SP(B) + SP(C) + SP(D) + SP(E)
Let's add the values from the table:
\(\text{Total SP} = 600 + 750 + 800 + 700 + 800\)
\(\text{Total SP} = 1350 + 800 + 700 + 800\)
\(\text{Total SP} = 2150 + 700 + 800\)
\(\text{Total SP} = 2850 + 800\)
\(\text{Total SP} = 3650\)
The total selling price for all 5 articles is 3650.
Finding the Ratio of Total CP to Total SP
The question asks for the ratio of total cost price to total selling price, which is Total CP : Total SP.
\(\text{Ratio} = \text{Total CP} : \text{Total SP}\)
\(\text{Ratio} = 2500 : 3650\)
To simplify the ratio, we find the greatest common divisor (GCD) of 2500 and 3650 and divide both numbers by it.
Both numbers end in 0, so they are divisible by 10.
\(\text{Ratio} = \frac{2500}{10} : \frac{3650}{10}\)
\(\text{Ratio} = 250 : 365\)
Now, we look for a common factor for 250 and 365. Both numbers end in 0 or 5, so they are divisible by 5.
\(\text{Ratio} = \frac{250}{5} : \frac{365}{5}\)
\(\text{Ratio} = 50 : 73\)
Now, let's check if 50 and 73 have any common factors other than 1. 50 has factors 1, 2, 5, 10, 25, 50. 73 is a prime number, meaning its only factors are 1 and 73. The only common factor is 1. So, the ratio \(50 : 73\) is in its simplest form.
The ratio of total cost price to total selling price of all articles is \(50 \ratio 73\).
Revision Table: Cost Price and Selling Price Analysis
Let's quickly summarize the key values calculated:
| Metric | Value |
|---|---|
| Total Cost Price | 2500 |
| Total Selling Price | 3650 |
| Ratio (Total CP : Total SP) | \(2500 : 3650\) |
| Simplified Ratio | \(50 : 73\) |
Additional Information: Ratios and Simplification
A ratio is used to compare two or more quantities of the same kind. It is often written with a colon (:) or as a fraction.
For example, a ratio of 2 : 3 means for every 2 units of the first quantity, there are 3 units of the second quantity.
Simplifying a ratio means dividing all parts of the ratio by their greatest common divisor (GCD) until the parts are relatively prime (have no common factors other than 1).
In our case, the ratio was \(2500 : 3650\). We found that 10 was a common factor: \(250 : 365\). Then we found that 5 was a common factor: \(50 : 73\). Since 50 and 73 have no common factors other than 1, the ratio \(50 : 73\) is the simplest form.
Understanding how to calculate sums and simplify ratios from data tables is a key skill for data interpretation questions.
Important Questions from Bar Graph and Line Graph
The table given below shows the cost price and value of profit of 6 articles.
Articles Cost price Profit D 700 200 E 600 150 F 400 300 G 500 400 H 300 250 I 800 350 Which of the following statement is NOT correct?
I. The profit of D, E and F is 30.63 percent of the cost price of G, H and I.
II. The ratio of total cost price to the total profit is 1 ∶ 2.
A ________ is often drawn as a guide, so that a frequency polygon can be drawn over the top.
The bar chart given below shows the number of boys and girls in 5 schools.
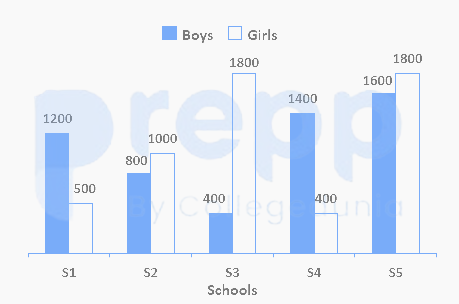
If the number of boys in school S6 are 30 percent more than the number of girls in school S1, then number of girls in schools S3 and S4 is what percentage of number of boys in schools S6 and S1 ? (correct to two decimal places)
The given histogram shows the heights of 232 students of an athletic club and their numbers.
Study the histogram carefully and answer the questions that follows.
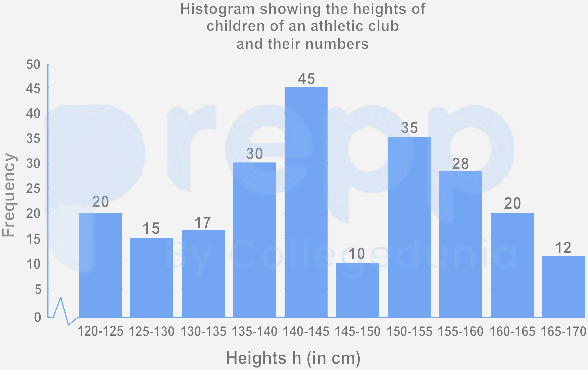
If the histogram is to be presented by a line diagram, what would be the starting point and the end point of the line diagram?
Directions:
These data are based on the bar graph and line graph.
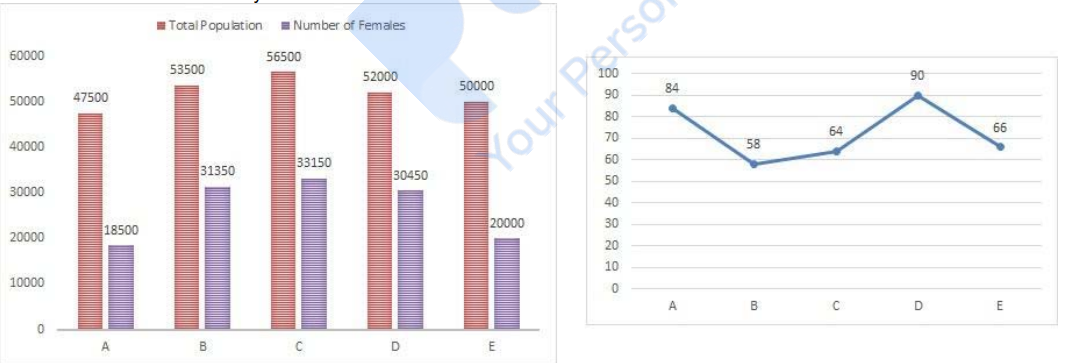
The following bar graph gives the total population of five cities(A, B, C, D and E) and number of females in the cities.
The following line graph gives the percentage of literates among females for each cities
Find the number of males in city B.