
Calculating Updated Sample Average
The problem asks us to find the new sample average after adding a new data point.
Initial Data Summary
- Initial number of data points ($n_1$): 50
- Initial sample average ($\bar{x}_1$): 40
Calculating Initial Sum
The sum of the initial data points can be calculated using the formula:
$ \text{Sum}_1 = n_1 \times \bar{x}_1 $
Substituting the values:
$ \text{Sum}_1 = 50 \times 40 = 2000 $
Updating Data and Sum
A new data point is added:
- New data point value: 142
- New number of data points ($n_2$): $50 + 1 = 51$
The new sum ($\text{Sum}_2$) is the initial sum plus the new data point:
$ \text{Sum}_2 = \text{Sum}_1 + 142 $
$ \text{Sum}_2 = 2000 + 142 = 2142 $
Calculating New Average
The updated sample average ($\bar{x}_2$) is calculated by dividing the new sum by the new number of data points:
$ \bar{x}_2 = \frac{\text{Sum}_2}{n_2} $
$ \bar{x}_2 = \frac{2142}{51} $
Performing the division:
$ \bar{x}_2 = 42 $
Conclusion
The updated sample average is exactly 42.
Important Questions from Mean Median Mode
A data set is given to be $[1, 2, 0, -1, -3, 1, 2, 0, 1]$.
The median of the data set is ____. (rounded off to the nearest integer)
- The following sequence of numbers is arranged in increasing order: 1, x, x, x, y, y, 9,16,18. Given that the mean and median are equal, and are also equal to twice the mode, the value of y is
The mean absolute deviation about the median for the data 3, 9, 5, 3, 12, 10, 18, 4, 7, 19, 21 (rounded off to two decimal places) is ________________.
- In a company with 100 employees, 45 earn Rs. 20,000 per month, 25 earn Rs. 30,000, 20 earn Rs. 40,000, 8 earn Rs. 60,000, and 2 earn Rs. 150,000. The median of the salaries is
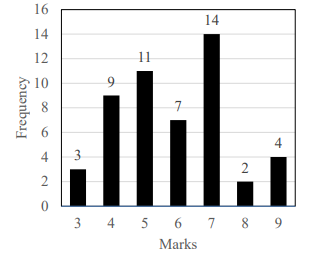
The above frequency chart shows the frequency distribution of marks obtained by a set of students in an exam. From the data presented above, which one of the following is CORRECT?


