
The above frequency chart shows the frequency distribution of marks obtained by a set of students in an exam. From the data presented above, which one of the following is CORRECT?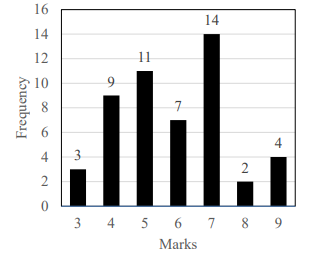
To determine the correct relationship between mean, median, and mode from the given frequency distribution, let's analyze the data presented in the frequency chart.
The chart shows the marks (3 to 9) with their corresponding frequencies. Let's calculate the mean, median, and mode.
- Mode: The mode is the value that appears most frequently in a data set. From the chart, mark '7' appears the most with a frequency of 14. Therefore, the mode is 7.
- Median: To find the median, we need to arrange the data in ascending order and find the middle value. Let's calculate the cumulative frequency:
- 3: Frequency = 3
- 4: Frequency = 9, Cumulative Frequency = 12
- 5: Frequency = 11, Cumulative Frequency = 23
- 6: Frequency = 7, Cumulative Frequency = 30
- 7: Frequency = 14, Cumulative Frequency = 44
- 8: Frequency = 2, Cumulative Frequency = 46
- 9: Frequency = 4, Cumulative Frequency = 50
- Both the 25th and 26th observations fall under mark '6' (in the cumulative frequency of 30).
- Mean: The mean is calculated using the formula:
- where \( f \) is the frequency and \( x \) is the mark.
- \( \sum (f \times x) = 3 \times 3 + 9 \times 4 + 11 \times 5 + 7 \times 6 + 14 \times 7 + 2 \times 8 + 4 \times 9 = 316 \)
- \( \sum f = 50 \)
Hence, we have Mode = 7, Median = 6, Mean = 6.32.
The relationship between them is: Mode > Median > Mean.
Important Questions from Mean Median Mode
A data set is given to be $[1, 2, 0, -1, -3, 1, 2, 0, 1]$.
The median of the data set is ____. (rounded off to the nearest integer)
- The following sequence of numbers is arranged in increasing order: 1, x, x, x, y, y, 9,16,18. Given that the mean and median are equal, and are also equal to twice the mode, the value of y is
- The sample average of 50 data points is 40. The updated sample average after including a new data point taking the value of 142 is ________.
The mean absolute deviation about the median for the data 3, 9, 5, 3, 12, 10, 18, 4, 7, 19, 21 (rounded off to two decimal places) is ________________.
- In a company with 100 employees, 45 earn Rs. 20,000 per month, 25 earn Rs. 30,000, 20 earn Rs. 40,000, 8 earn Rs. 60,000, and 2 earn Rs. 150,000. The median of the salaries is


