The following table shows the percentage (%) distribution of total marks scored by Amit (a student in a class) in Test-1 and Test-2. Both Tests consist of six subjects, namely, Mathematics, Physics, Chemistry, Hindi, IT and English. Amit scored a total of 750 and 800 marks in Test-1 and Test-2, respectively. Based on the data in the table, answer the questions that follow. Subject-wise Distribution of Marks Subject Distribution (%) of Marks Test-1 Test-2 Mathematics 20% 21.750% Physics 22% 18.125% Chemistry 16% 18.000% Hindi 14% 16.250% IT 10% 12.375% English 18% 13.500%
The marks scored by Amit in Mathematics in Test-2 is _________ % of the marks scored by him in the same subject in Test-1.
116
Marks obtained in Mathematics in Exam 1 = 20/100 × 750 = 150
Marks obtained in Mathematics in Exam 2 = 174
Percentage = (174/150) × 100 = 116%
Therefore, the answer is 116.
Important Questions from Tabulation
- An object is placed beyond the centre of curvature (C) of a concave mirror. The image formed will be now:
Directions:
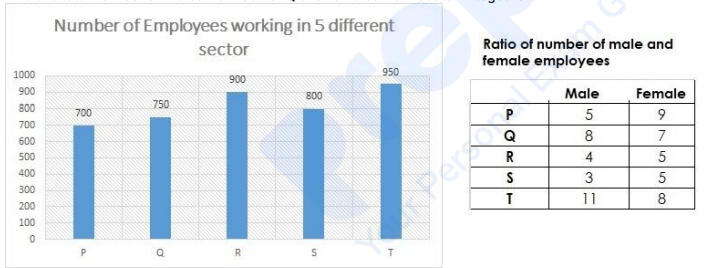
Using the data from the graph answer the question below:
Find the total number of males from sector P and females from sector R together.
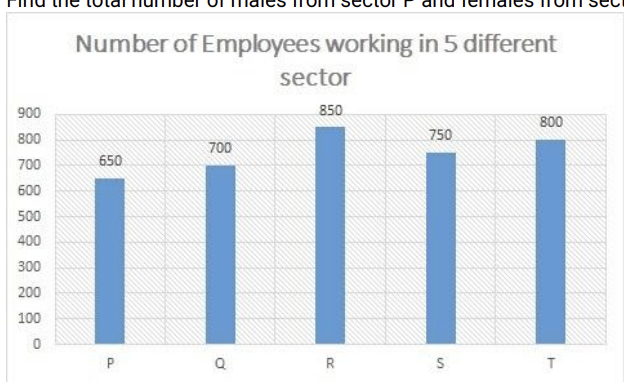
Ratio of number of male and female employees
Male Female P 6 7 Q 5 9 R 9 8 S 7 8 T 3 5 Directions:
Using the data from the graph answer the question below:
Number of Employees working in 5 different sector:
Find the number of males from sector Q.
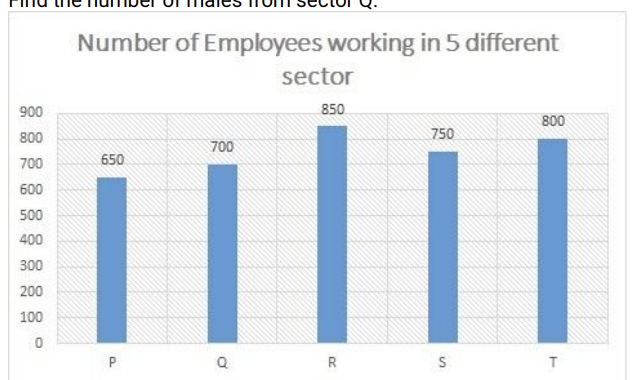
Ratio of number of male and female employees:
Male Female P 6 7 Q 5 9 R 9 8 S 7 8 T 3 5 Directions:
Using the data from the graph answer the question below:
Find the ratio between number of males from the sector T to number of females from the sector S.
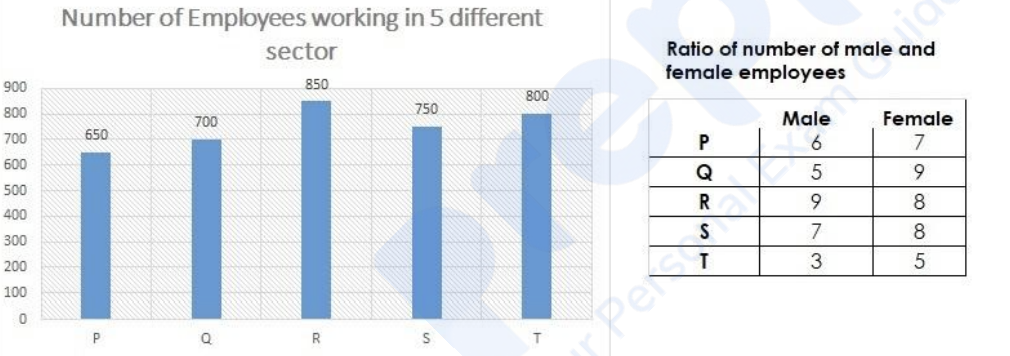
Directions:
Using the data from the graph answer the question below:
Find the total number of males from sector Q and females from sector P together.