
The graph shows cumulative frequency % of research scholars and the number of papers published by them. Which of the following statements is true?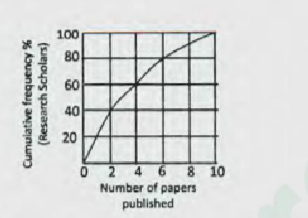
To solve this problem, we need to analyze the cumulative frequency graph provided, which shows the percentage of research scholars against the number of papers they have published.
The graph provides cumulative percentages, which means each point on the graph indicates the percentage of scholars who have published up to that many papers.
- Analyzing the Graph:
- From the graph, it appears that at around the 2-paper mark, the cumulative percentage is approximately 40%.
- This indicates that 40% of the scholars published up to 2 papers.
- Understanding the Statements:
- Option 1: "Majority of the scholars published more than 4 papers." - The cumulative frequency for 4 papers is around 70%. Therefore, 30% published more than 4 papers. This is not the majority.
- Option 2: "60% of the scholars published at least 2 papers." - Since 40% of scholars published up to 2 papers, it follows that 60% (100% - 40%) published at least 2 papers. This statement is true.
- Option 3: "80% of the scholars published at least 6 papers." - The cumulative frequency at 6 papers is approximately 90%. This means 10% published more than 6 papers, not 80%.
- Option 4: "30% of scholars have not published any paper." - The graph starts at 0% at 0 papers, indicating that this is not the case.
Conclusion: The correct statement is: 60% of the scholars published at least 2 papers.
Important Questions from Data Interpetation (Notes)
The population of a town over the years 2000-2007 is shown in the given figure.
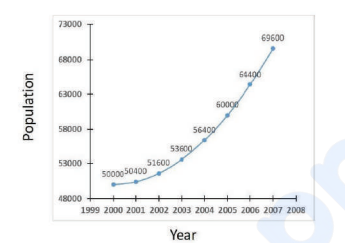
It can be inferred that during 2000-2007,
The areas (in km²) under forests in four countries A, B, C and D for the years 2014 and 2024 are shown in the given bar chart:
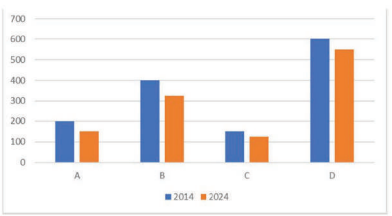
The minimum percentage of deforestation during 2014-2024 was in country- Find the average amount collected from the sales of Bengali dishes, Punjabi dishes and Gujarati dishes.
- The amount collected by selling Chinese dishes is approximately what percentage more than the amount collected by selling Bengali dishes?
- The number of questions asked in shift I from the topic Profit-Loss is what percent more than the number of questions asked in shift II from the topic Average?


