
The following line graph shows the number of questions asked from different topics of quantitative aptitude in two shifts of CAT exam. Study the following line graph carefully and answer the question that follows.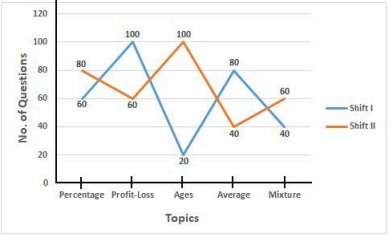
To solve this problem, we need to determine how many more questions from the Profit-Loss topic in Shift I were asked compared to questions from the Average topic in Shift II, and express this difference as a percentage. Let's break it down step-by-step:
-
Understand the data from the line graph:
- From the graph, note the number of questions from Profit-Loss in Shift I.
- Also, note the number of questions from Average in Shift II.
-
Calculate the difference:
- Let \( P_1 \) represent the number of questions from Profit-Loss in Shift I.
- Let \( A_2 \) represent the number of questions from Average in Shift II.
- The difference in the number of questions is \( P_1 - A_2 \).
-
Calculate the percentage increase:
- The percentage increase is given by the formula: \[\left(\frac{P_1 - A_2}{A_2}\right) \times 100\%\]
-
Insert the values and compute:
- For example, if the graph shows \( P_1 = 50 \) and \( A_2 = 20 \), then:
- The difference is \( 50 - 20 = 30 \).
- The percentage increase is \[\left(\frac{30}{20}\right) \times 100\% = 150\%\]
-
Conclusion:
- The number of questions from Profit-Loss in Shift I is 150% more than the number of questions from Average in Shift II.
Therefore, the correct answer is 150%.
Important Questions from Data Interpetation (Notes)
The population of a town over the years 2000-2007 is shown in the given figure.
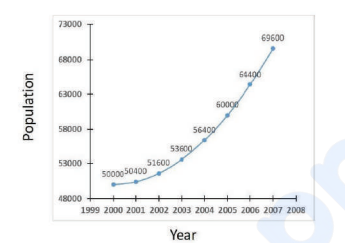
It can be inferred that during 2000-2007,
The areas (in km²) under forests in four countries A, B, C and D for the years 2014 and 2024 are shown in the given bar chart:
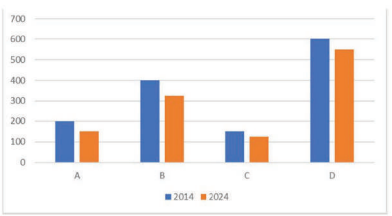
The minimum percentage of deforestation during 2014-2024 was in country- Find the average amount collected from the sales of Bengali dishes, Punjabi dishes and Gujarati dishes.
- The amount collected by selling Chinese dishes is approximately what percentage more than the amount collected by selling Bengali dishes?
- What is the ratio of number of questions asked from the topics Profit-Loss and Percentage taken together in shift I to those asked from the topics Ages and Average taken together is shift II?


