
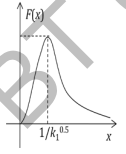
The graph of the function $F(x) = \frac{x}{k_1 x^2 + k_2 x + 1}$ for $0 < x < \infty$ is
To solve the problem of determining the graph of the function \( F(x) = \frac{x}{k_1 x^2 + k_2 x + 1} \) for \( 0 < x < \infty \), we need to analyze the behavior of this function. Let's break down the steps:
- The function is a rational function where the numerator is \( x \) and the denominator is a quadratic expression \( k_1 x^2 + k_2 x + 1 \).
- As \( x \to 0 \), the function simplifies to \( F(x) \approx \frac{x}{1} = x \). Thus, near zero, the function behaves approximately linearly, increasing from the origin.
- As \( x \to \infty \), the term \( k_1 x^2 \) dominates the denominator, so the function approximates to: \[ F(x) \approx \frac{x}{k_1 x^2} = \frac{1}{k_1 x} \] It indicates that the function approaches zero as \( x \) increases indefinitely.
- The function does not have any asymptotes in the positive \( x \)-region, other than the horizontal asymptote at \( y = 0 \) as \( x \to \infty \).
- Analyzing possible points of inflection or changes in concavity would involve taking the derivative and setting it to zero, but for graph sketching it suffices to note the behaviors near \( x=0 \) and as \( x \to \infty \).
Given these observations, the correct graph would start at the origin, increase initially and then decrease towards zero. Comparing with the options provided:
This graph (Figure 1) matches the described behavior: it rises from zero and then gradually declines to zero at infinity, without crossing the x-axis again.
Important Questions from Kinetics of Cell Growth Substrate Utilization and Product Formation
If the rate at which $E. coli$ divides is $0.5 \text{ h}^{-1}$, then its doubling time is _______________ h.
- Which of the following factors can affect the growth of a microbial culture in a batch cultivation process?
Let $y(t)$ be a bacterial population whose growth is given by
$ \frac{dy}{dt} = \lambda(y + 2) $
where $ \lambda $ is the growth rate constant. If $y(0) = 1$ and $y(1) = 4$, then the value of $ \lambda $ is
If the doubling time of a bacterial population is 3 hours, then its average specific growth rate during this period is _________ $h^{-1}$.
(Round off to two decimal places)
- A microorganism is grown in a batch culture using glucose as a carbon source. The apparent growth yield is $0.5 \frac{\text{g biomass}}{\text{g substrate}}$. The initial concentrations of biomass and substrate are $2 \text{ g L}^{-1}$ and $200 \text{ g L}^{-1}$, respectively. Assuming that there is no endogenous metabolism, the maximum biomass concentration that can be achieved is ________ $\text{g L}^{-1}$.


