
The graph below shows how the lower limits of the elevational ranges of bird species on a tropical mountain have changed over 20 years (2000 to 2020) because of climate change. Each point below represents a bird species. Points would cluster on the dashed line if species had the same lower elevational range limits in 2000 and 2020. Given that the mountain summit is at an elevation of 3500 m (solid horizontal line), and assuming that the trend shown by the graph continues over the next 20 years, what would you expect in 2040?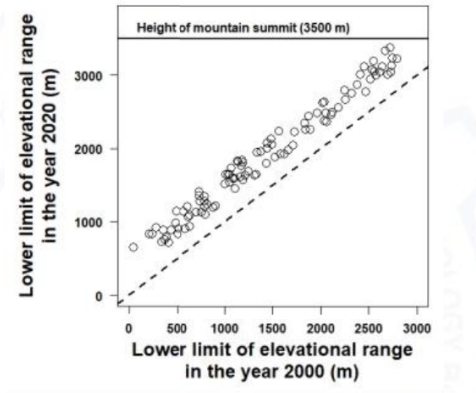
High-elevation species will become locally extinct.
To predict what will happen by the year 2040, we must analyze the current trend of species movement relative to the mountain's physical limit (the summit).
1. Analysis of the 2000–2020 Trend
The graph compares the lower elevational limit of species in the year 2000 (\(x\)-axis) to their limit in 2020 (\(y\)-axis):
- The dashed line represents a scenario where there is no change (\(y = x\)).
- Almost all data points are located above the dashed line, meaning: $$y > x$$
- This indicates that the lower elevational range limits of bird species have shifted upward over the 20-year period due to climate change (warming temperatures).
2. The "Escalator to Extinction"
As species move higher to remain within their preferred temperature niches, they eventually encounter the physical boundary of the mountain:
- The mountain summit is a fixed limit at 3500 m (the solid horizontal line).
- High-elevation species (those that started near 2500–3000 m in 2000) are already very close to the summit in 2020.
- For example, species that were at 3000 m in 2000 have shifted to approximately 3300 m in 2020.
3. Prediction for 2040
If the trend continues linearly for another 20 years:
- Species currently at 3300 m would be expected to shift their range limit by another few hundred meters upward.
- This would push their required habitat above the 3500 m summit.
- Since there is no land (and thus no habitat) above the summit, these species will have nowhere to go.
Conclusion
Because high-elevation species are the first to run out of space as they shift upward toward the summit, they are the most vulnerable to habitat loss.
The correct expectation for 2040 is: "High-elevation species will become locally extinct."
Important Questions from Abiotic factors
- Species that co-occur in space and time tend to be similar to each other in traits such as tolerance to heat or to drought. This is most likely because of _________.
- A researcher carried out an experiment to study how daylength and temperature influence diapause in a moth species. He placed larvae in one of four treatment conditions for 2 weeks, with 30 larvae in each condition. The treatments involved two temperatures ($18\text{ }^\circ\text{C}$ or $27\text{ }^\circ\text{C}$) and two lighting conditions (12h:12h Light:Dark (LD) or complete darkness (DD)). At the end of the experiment, he counted the number of larvae that had entered diapause and those that had not. The data are shown below.Which one or more of the following conclusions can he reasonably make from these findings?
Condition Larvae in diapause Larvae NOT in diapause Treatment 1 $27\text{ }^\circ\text{C}$, 12:12 LD 2 28 Treatment 2 $18\text{ }^\circ\text{C}$, 12:12 LD 7 23 Treatment 3 $27\text{ }^\circ\text{C}$, DD 12 18 Treatment 4 $18\text{ }^\circ\text{C}$, DD 29 1 - Terrestrial plants conduct gas exchange through stomata. Having only few stomata on the leaf surface is a common adaptation to which one of the following conditions?
- Some air-breathing marine vertebrates such as whales, seals and marine turtles possess adaptations for long, deep dives. Which one or more of the following is/are examples of such adaptations?
- Which one or more of the following is/are greenhouse gas(es)?


