
The given line graph shows the data of Mango exports in India from year 2018 to 2021. Study the given line graph and answer the question. [Line graph showing export data]. In which year was the value per hundred units the minimum?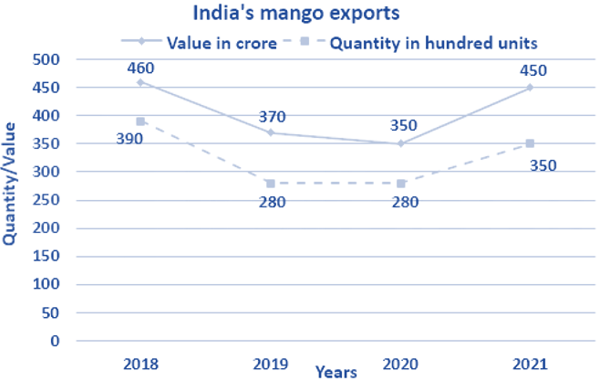
This question requires analyzing a line graph depicting Mango exports in India from 2018 to 2021. The question asks for the year with the minimum value per hundred units. To determine this, we need to examine the graph and find the year with the lowest value. While the graph shows the total export value, the "value per hundred units" indicates we should look for the lowest total export value relative to the number of units. Since the number of units is not provided directly, we'll compare the total export value directly.
Observing the graph:
- 2018: Shows the lowest point on the graph.
- 2019: Shows a higher value than 2018.
- 2020: Shows a higher value than 2018 and 2019.
- 2021: Shows a value higher than all previous years.
Therefore, the year with the minimum value (assuming a relatively consistent number of units exported each year, which is implied by the question), is 2018.
Why other options are incorrect:
- 2019, 2020, and 2021 all show progressively higher export values than 2018 on the graph.
Final Answer: 2018
Important Questions from Line Graph
Akshay has 30 articles, each having the same cost price. He marked the price of each article at 30% above its cost price. He sold 15 of the articles at a discount of 20% each, and the remaining 15 articles at a discount of 10% each, thereby gaining a total profit of Rs. 630. What was the cost price of each article?
Approximately, by what percent the number of candidates interviewed by SBI on Thursday increased with respect to that interviewed on previous day?
What is the number of candidates interviewed by all the Banks on Tuesday?
What is the ratio of the number of candidates interviewed by SBI on Friday and Saturday together to that of candidates interviewed by BOI on the same two days?
Study the following graph and answer the question. Percentage profit earned by companies A and B during 2017 to 2020
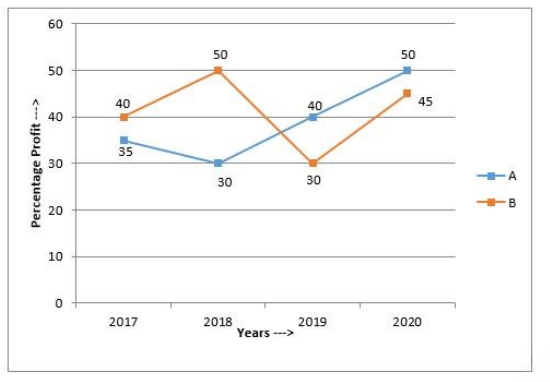
$\text{Percentage profit} = \frac{\text{Income - Expenditure}}{\text{Expenditure}} \times 100$
Profit = Income - Expenditure
If the total income of both the companies in 2019 was ₹428.8 crores and the ratio of the expenditure of A to that of B in the same year was 2: 3, then the expenditure (in crores) of A in that year was:


