Akshay has 30 articles, each having the same cost price. He marked the price of each article at 30% above its cost price. He sold 15 of the articles at a discount of 20% each, and the remaining 15 articles at a discount of 10% each, thereby gaining a total profit of Rs. 630. What was the cost price of each article?
Rs. 200
Understanding the Profit and Loss Problem
This problem involves calculating the original cost price of articles based on their marked price, different discounts applied during sales, and the total profit earned. We need to use concepts of cost price, marked price, selling price, discount percentage, and profit.
Step-by-Step Solution to Find the Cost Price
Let's denote the cost price (CP) of each article by \( \text{Rs. } x \).
There are a total of 30 articles, and each has the same cost price \( x \).
- Total Cost Price = \( 30 \times x = 30x \)
The marked price (MP) of each article is set at 30% above its cost price.
- Marked Price (MP) of one article = \( \text{CP} + 30\% \text{ of CP} \)
- MP of one article = \( x + 0.30x = 1.30x \)
Akshay sells the 30 articles in two lots:
- 15 articles are sold at a discount of 20% each.
- The remaining 15 articles are sold at a discount of 10% each.
Calculating Selling Price for the First Lot (15 articles)
Discount on each article is 20% of the Marked Price.
- Discount amount = \( 20\% \text{ of MP} = 0.20 \times 1.30x = 0.26x \)
- Selling Price (SP) of one article in this lot = \( \text{MP} - \text{Discount Amount} \)
- SP of one article = \( 1.30x - 0.26x = 1.04x \)
- Total SP for the first 15 articles = \( 15 \times 1.04x = 15.6x \)
Calculating Selling Price for the Second Lot (15 articles)
Discount on each article is 10% of the Marked Price.
- Discount amount = \( 10\% \text{ of MP} = 0.10 \times 1.30x = 0.13x \)
- Selling Price (SP) of one article in this lot = \( \text{MP} - \text{Discount Amount} \)
- SP of one article = \( 1.30x - 0.13x = 1.17x \)
- Total SP for the remaining 15 articles = \( 15 \times 1.17x = 17.55x \)
Calculating Total Selling Price and Total Profit
- Total Selling Price (SP) for all 30 articles = \( \text{SP of first 15 articles} + \text{SP of remaining 15 articles} \)
- Total SP = \( 15.6x + 17.55x = 33.15x \)
The total profit is given as Rs. 630.
- Total Profit = Total Selling Price - Total Cost Price
- \( 630 = 33.15x - 30x \)
- \( 630 = 3.15x \)
Solving for the Cost Price (x)
We need to solve the equation \( 3.15x = 630 \) for \( x \).
- \( x = \frac{630}{3.15} \)
To make the division easier, we can multiply both the numerator and the denominator by 100:
- \( x = \frac{630 \times 100}{3.15 \times 100} = \frac{63000}{315} \)
Now, perform the division:
- \( 63000 \div 315 \)
- We know that \( 315 \times 2 = 630 \).
- So, \( 315 \times 200 = 63000 \).
- Therefore, \( x = 200 \).
The cost price of each article is Rs. 200.
Verification
Let's verify the answer by calculating the total profit with \( x = 200 \).
- CP of one article = Rs. 200
- MP of one article = \( 1.30 \times 200 = \text{Rs. } 260 \)
- SP of one article (20% discount) = \( 1.04 \times 200 = \text{Rs. } 208 \)
- SP of one article (10% discount) = \( 1.17 \times 200 = \text{Rs. } 234 \)
- Total SP for first 15 articles = \( 15 \times 208 = \text{Rs. } 3120 \)
- Total SP for remaining 15 articles = \( 15 \times 234 = \text{Rs. } 3510 \)
- Total SP for all 30 articles = \( 3120 + 3510 = \text{Rs. } 6630 \)
- Total CP for 30 articles = \( 30 \times 200 = \text{Rs. } 6000 \)
- Total Profit = Total SP - Total CP = \( 6630 - 6000 = \text{Rs. } 630 \)
The calculated total profit matches the given total profit, confirming our answer.
The cost price of each article is Rs. 200.
| Concept | Formula/Value (in terms of x) | Formula/Value (with x=200) |
|---|---|---|
| Cost Price (CP) of 1 article | \( x \) | Rs. 200 |
| Total CP (30 articles) | \( 30x \) | Rs. 6000 |
| Marked Price (MP) of 1 article | \( 1.30x \) | Rs. 260 |
| SP of 1 article (20% discount) | \( 1.04x \) | Rs. 208 |
| SP of 1 article (10% discount) | \( 1.17x \) | Rs. 234 |
| Total SP (First 15 articles) | \( 15.6x \) | Rs. 3120 |
| Total SP (Next 15 articles) | \( 17.55x \) | Rs. 3510 |
| Total SP (30 articles) | \( 33.15x \) | Rs. 6630 |
| Total Profit | \( 3.15x \) | Rs. 630 |
Revision Table: Profit and Loss Concepts
| Term | Definition | Formula |
|---|---|---|
| Cost Price (CP) | The price at which an article is bought. | - |
| Marked Price (MP) | The price at which an article is listed for sale. | Often CP + Markup |
| Selling Price (SP) | The price at which an article is sold. | MP - Discount OR CP + Profit |
| Discount | Reduction offered on the Marked Price. | Discount % of MP |
| Profit | Occurs when SP > CP. | SP - CP |
| Profit Percentage | Profit as a percentage of CP. | \( (\frac{\text{Profit}}{\text{CP}}) \times 100\% \) |
| Loss | Occurs when SP < CP. | CP - SP |
| Loss Percentage | Loss as a percentage of CP. | \( (\frac{\text{Loss}}{\text{CP}}) \times 100\% \) |
Additional Information on Pricing and Profit Calculations
Understanding the relationships between Cost Price, Marked Price, Selling Price, Discount, and Profit is crucial for solving problems like this. Here are some additional points:
- The marked price is often higher than the cost price to allow for discounts and still make a profit.
- Discount is always calculated on the marked price, unless stated otherwise.
- Profit or Loss is always calculated based on the cost price, unless stated otherwise.
- Different articles or batches of articles can be sold at different selling prices, depending on the discounts offered.
- The total profit (or loss) is the difference between the total selling price of all items sold and the total cost price of those items.
Important Questions from Line Graph
Approximately, by what percent the number of candidates interviewed by SBI on Thursday increased with respect to that interviewed on previous day?
What is the number of candidates interviewed by all the Banks on Tuesday?
What is the ratio of the number of candidates interviewed by SBI on Friday and Saturday together to that of candidates interviewed by BOI on the same two days?
Study the following graph and answer the question. Percentage profit earned by companies A and B during 2017 to 2020
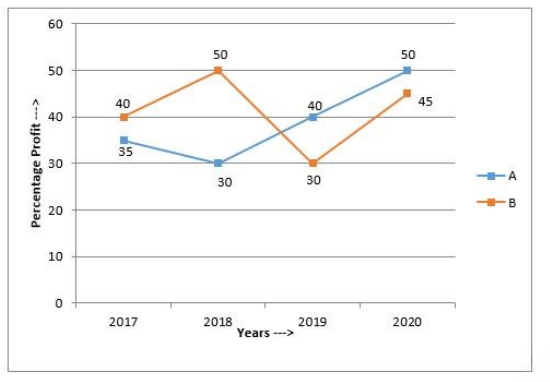
$\text{Percentage profit} = \frac{\text{Income - Expenditure}}{\text{Expenditure}} \times 100$
Profit = Income - Expenditure
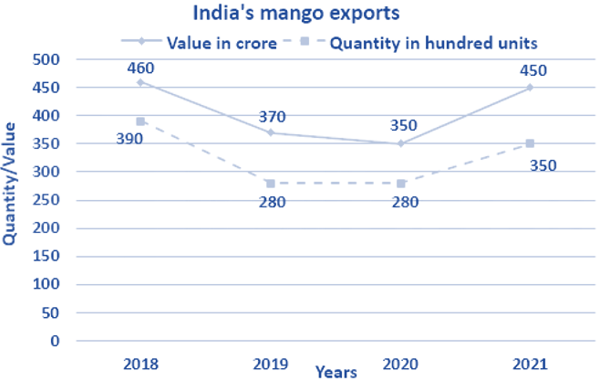
If the total income of both the companies in 2019 was ₹428.8 crores and the ratio of the expenditure of A to that of B in the same year was 2: 3, then the expenditure (in crores) of A in that year was:The given line graph shows the data of Mango exports in India from year 2018 to 2021. Study the given line graph and answer the question. [Line graph showing export data]. In which year was the value per hundred units the minimum?