The following table shows the number of candidates interviewed by five Indian Banks on six different working days from Monday to Saturday. Some values (marked as '-') are missing in the table which you are expected to calculate if required. Based on the data in the table, answer the questions. Day-wise Interview of Candidates by Banks Day Number of candidates Interviewed by PNB BOI IDBI SBI BOB Monday 34 36 46 50 36 Tuesday 42 - 28 56 50 Wednesday 46 44 46 - 36 Thursday - 28 24 46 36 Friday 20 20 - 30 44 Saturday 34 52 40 40 48 Total Interviewed 224 218 216 246 250
Approximately, by what percent the number of candidates interviewed by SBI on Thursday increased with respect to that interviewed on previous day?
Given:
SBI (Thursday) = 46
Calculation:
Number of candidates interviewed by SBI on Wednesday = 246 - 50 - 56 - 46 - 30 - 40 = 24
$$\Rightarrow \text{Required percentage increase} = \frac{46 - 24}{24} \times 100 = 91.67\% \approx 92\%$$
Therefore, the number of candidates interviewed by SBI on Thursday showed an increase of 92% compared to the number of candidates interviewed on the previous day.
Important Questions from Line Graph
Akshay has 30 articles, each having the same cost price. He marked the price of each article at 30% above its cost price. He sold 15 of the articles at a discount of 20% each, and the remaining 15 articles at a discount of 10% each, thereby gaining a total profit of Rs. 630. What was the cost price of each article?
What is the number of candidates interviewed by all the Banks on Tuesday?
What is the ratio of the number of candidates interviewed by SBI on Friday and Saturday together to that of candidates interviewed by BOI on the same two days?
Study the following graph and answer the question. Percentage profit earned by companies A and B during 2017 to 2020
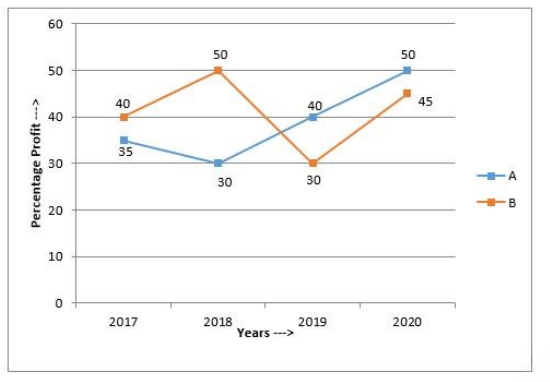
$\text{Percentage profit} = \frac{\text{Income - Expenditure}}{\text{Expenditure}} \times 100$
Profit = Income - Expenditure
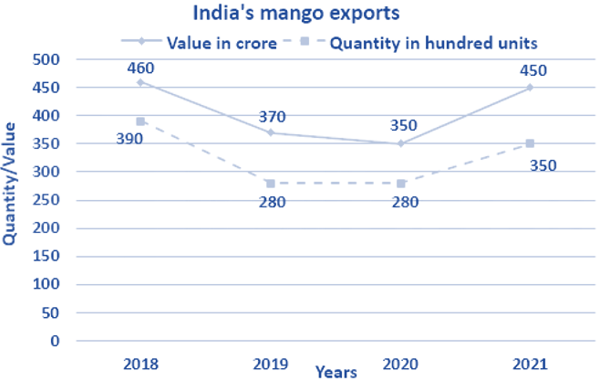
If the total income of both the companies in 2019 was ₹428.8 crores and the ratio of the expenditure of A to that of B in the same year was 2: 3, then the expenditure (in crores) of A in that year was:The given line graph shows the data of Mango exports in India from year 2018 to 2021. Study the given line graph and answer the question. [Line graph showing export data]. In which year was the value per hundred units the minimum?