
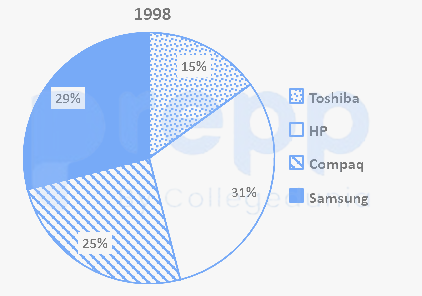
The given chart represents the sales of different companies in the year 1999 and 1998. If the total sales in 1998 was 7890, which increased by 16.5% in 1999, then the total sales in the year 1999 is approximately _______.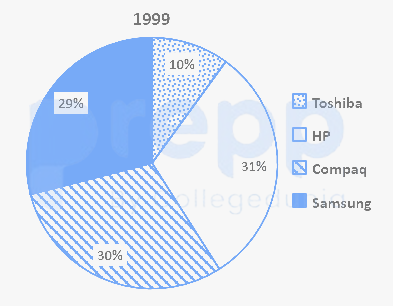
9191
Calculation:
Total sales in 1999 = 7890 + 7890 × 16.5%
⇒ 7890 + 1301.85
⇒ 9191.85 ≈ 9191
∴ The required answer is 9191.
Similar Questions
Based on the given data, what is the ratio of calcium to iron found in the human body?
If the total production is 9000 tons, then find the yield of rice in tons.
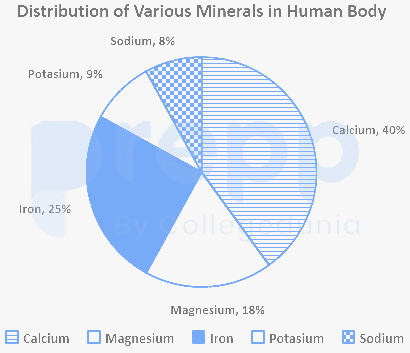
The given graph shows the distribution of minerals in the human body.
Based on the given data, if a person has a total of 1000 IU of all the mentioned minerals in his body, what is the units of calcium distributed in his body?
Based on the given data, what is the ratio of the metal with the highest percentage of distribution to that with the lowest percentage of distribution in the human body?
Based on the given data, what is the ratio of the metal with the second highest percentage of distribution to that with the second lowest percentage of distribution in the human body?
The chart represents the domestic expenditure of a family per month. If the family income is ₹33,650 then the total money spent by the family on entertainment and food together per month is:
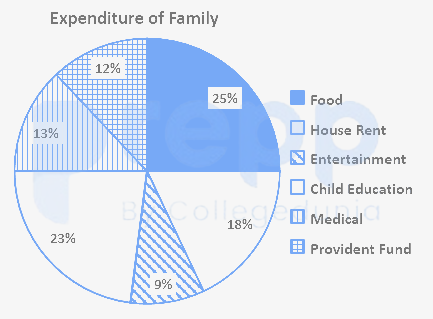
Expenditure of family
Provident Fund
Food
House Rent
Entertainment
Child Education
Medical
Which two minerals are required almost in the same percentage for the human body?
If the yield of sugar is 6000 tons then the yield of wheat will be _____ tons.
The pie chart shows the breakup in percentage of the various expenses of a Company. Study the diagram and answer the following question.
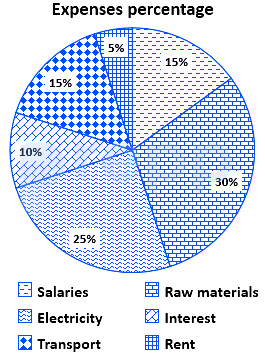
What is the interest expense if total expenses is Rs. 25000.
- The given chart shows the marks scored by a class X student in different subjects.
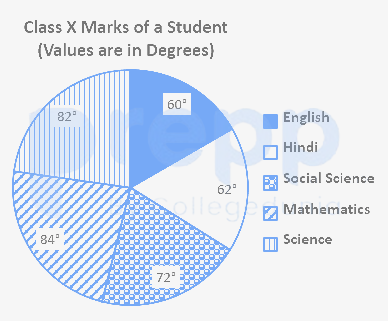
If the total marks are 1800, then find the difference between the marks scored in science and mathematics.
Important Questions from Pie Chart
Study the following pie-charts carefully to answer the questions.
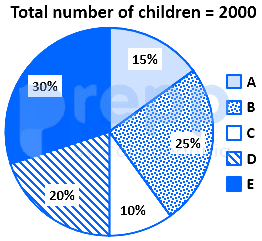
If 70 percent children from village D go to school then what is the number of children attending school from village D ?
Study the following pie-charts carefully to answer the questions.Percentage break-up of number of children in five different villages
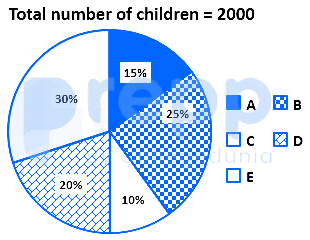
What is the respective ratio of total number of children from village A to village C ?
Study the following pie-charts carefully to answer the questions.Percentage break-up of number of children in five different villages
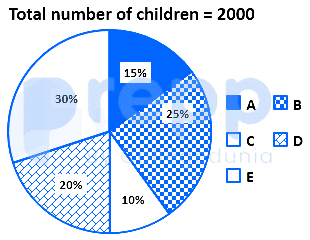
What is the total number of children in villages B and E ?
Study the chart and answer the question based, on the pie chart.The pie chart is given below shows expenditures incurred by a family on various items and savings in a month. Savings of the family is ₹ 8,000 in a month.
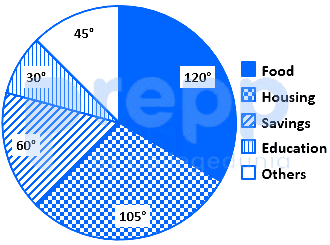
What is the total expenditure of the family for the month?
Study the chart and answer the question based, on the pie chart.The pie chart given below shows expenditures incurred by a family on various items and savings in a month. Savings of the family is ₹ 8,000 in a month.
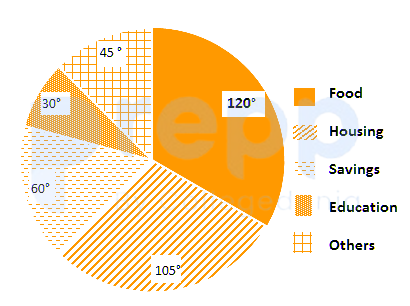
How much more amount is spent on food than on housing?



