
Question
The figure which represents $y = \frac{\sin x}{x}$ for $x > 0$ (x in radians) is
The correct answer is
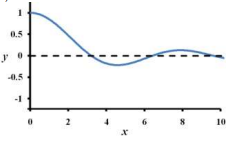
To find the correct graph for the function $y = \frac{\sin x}{x}$ for $x > 0$, we need to analyze its behavior.
Graph Analysis: $y = \frac{\sin x}{x}$ for $x > 0$
-
Behavior near $x=0$: As $x$ approaches 0 from the positive side ($x \to 0^+$), the limit of the function is 1.
$ \lim_{x \to 0^+} \frac{\sin x}{x} = 1 $
This means the graph should start near the point $(0, 1)$. -
Behavior for $x>0$:
- The function oscillates due to the $\sin x$ term.
- The amplitude of the oscillations decreases as $x$ increases because of the $1/x$ factor.
- The function crosses the x-axis (where $y=0$) when $\sin x = 0$ and $x \neq 0$. This occurs at $x = \pi, 2\pi, 3\pi, \dots$.
-
Evaluating the Options:
- Option 1: Shows oscillations, but the amplitude appears constant, not decreasing.
- Option 2: Starts near $y=1$ as $x \to 0^+$, shows oscillations with decreasing amplitude, and crosses the x-axis at multiples of $\pi$. This matches the expected behavior.
- Option 3: Shows oscillations with increasing amplitude.
- Option 4: Shows a monotonically decreasing function, not oscillations.
Therefore, the figure representing $y = \frac{\sin x}{x}$ for $x > 0$ is the one showing decaying oscillations starting from $y=1$ at $x=0^+$. This corresponds to Option 2.
Was this answer helpful?
Important Questions from Functions Of Single Variable
- The gradient of $y = 3x^2 \sin(2x)$ at (0.2, 1) is __________ (rounded off to three decimal places).
- Let $ f(x) = x - [x] $, where $ x \ge 0 $ and $ [x] $ is the greatest integer not larger than x. Then $ f(x) $ is a
Consider the hyperbolic functions in Group – 1 and their definitions in Group - 2.
Group - 1 Group - 2 P $\tanh x$ I $\frac{e^x + e^{-x}}{e^x - e^{-x}}$ Q $\coth x$ II $\frac{2}{e^x + e^{-x}}$ R $\text{sech } x$ III $\frac{2}{e^x - e^{-x}}$ S $\text{cosech } x$ IV $\frac{e^x - e^{-x}}{e^x + e^{-x}}$ The correct combination is
- The equation of the straight line representing the tangent to the curve $y = x^2$ at the point $(1,1)$ is
- Consider the function $y = e^x$. The slope of this function at $x = 10$ is
Need Expert Advice?


