
Question
The distribution of marks of students in a class is given by the following chart: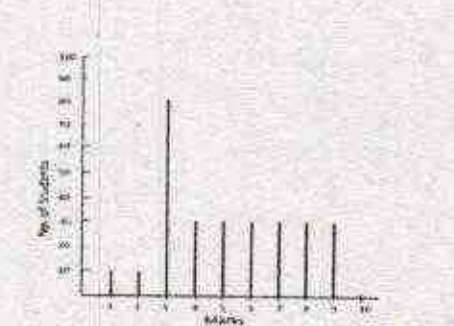
If 3.30 marks is the passing score in a 10 mark question paper, which of the following is false?
The correct answer is
Average marks of students who have failed is below 20%
To solve this problem, we need to analyze the given distribution chart of marks and verify the truth of each statement provided in the options.
- Majority of the students have scored above the pass mark: The pass mark is 3.30. By observing the chart, a significant portion of the students have marks greater than 3. Therefore, this statement is likely true.
- Mode of the distribution is 3: The mode is the value that appears most frequently. From the chart, the highest bar corresponds to the score of 3 marks. Hence, this statement is true.
- Average marks of passing students is above 55%: Passing students are those with scores greater than or equal to 3.30. Calculating their average, if it exceeds 5.5 (55% of 10 marks), then this statement is true. By inspection of the distribution, passing students appear to have higher scores on average, supporting this statement.
- Average marks of students who have failed is below 20%: Failing students have marks less than 3.30. The average mark for failed students, which would be below 2, appears inconsistent given the distribution. Hence, this statement is false.
From the above analysis, the false statement is: Average marks of students who have failed is below 20%.
Was this answer helpful?
Important Questions from Data Interpetation (Notes)
The population of a town over the years 2000-2007 is shown in the given figure.
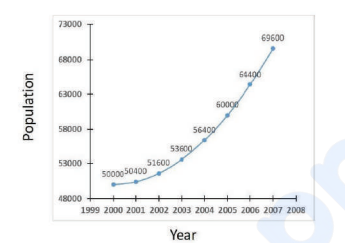
It can be inferred that during 2000-2007,
The areas (in km²) under forests in four countries A, B, C and D for the years 2014 and 2024 are shown in the given bar chart:
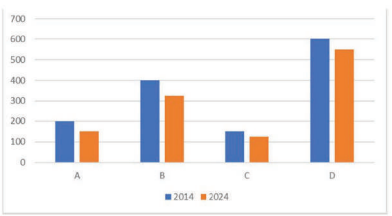
The minimum percentage of deforestation during 2014-2024 was in country- Find the average amount collected from the sales of Bengali dishes, Punjabi dishes and Gujarati dishes.
- The amount collected by selling Chinese dishes is approximately what percentage more than the amount collected by selling Bengali dishes?
- The number of questions asked in shift I from the topic Profit-Loss is what percent more than the number of questions asked in shift II from the topic Average?
Need Expert Advice?


