The bar graph given below shows the sales of books from six schools during two consecutive years, 2013 and 2014. What percentage of the average sales of the schools A, B, and C in 2014 is the average sales of schools A, C, and F in 2013?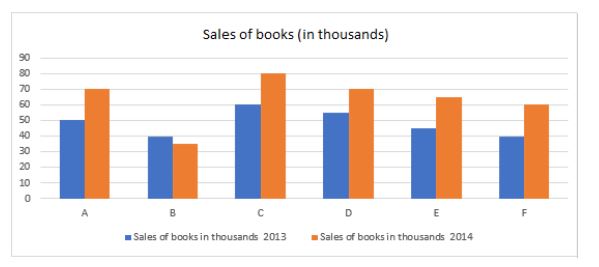
81.08%
Calculate the average sales of schools A, B, and C in 2014 and schools A, C, and F in 2013 from the bar graph.
Then, use the formula: (Average sales in 2013 / Average sales in 2014) × 100 to get 81.08%.
Similar Questions
Study the given table answer the question that follows. The following table shows the income of a person (in thousand rupees) per annum over the given years.
Year School Salary Coaching Home Tuition 2018 132 42 12 2019 148 55 18 2020 166 68 24 2021 178 74 28 2022 196 88 35 What is the average income from school as a salary per year earned by the person over the given years?
The graph shows the monthly expenditure of a company (unit = 10 lakhs). Study the graph and answer the questions.
The percentage of money spent on miscellaneous is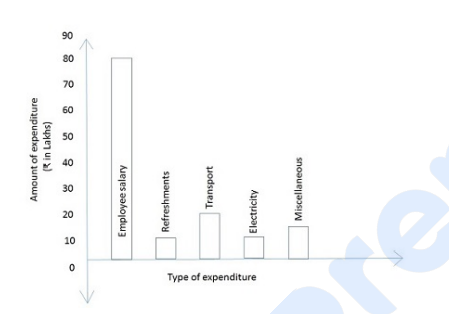
The graph shows the monthly expenditure of a company (unit = 10 lakhs). Study the graph and answer the questions.
The fraction of money spent on refreshments is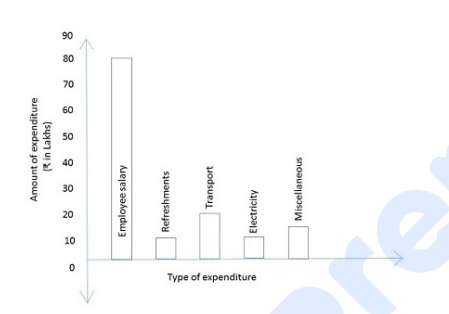
The graph shows the monthly expenditure of a company (unit = 10 lakhs). Study the graph and answer the questions.
The total monthly expenditure of the company is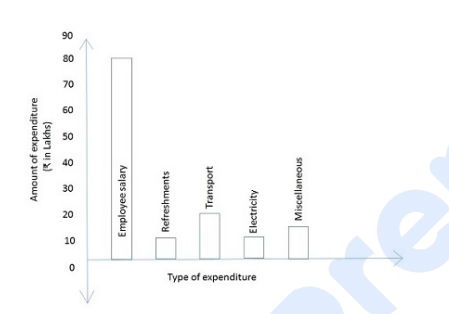
The graph shows the monthly expenditure of a company (unit = 10 lakhs). Study the graph and answer the questions.
The ratio between transport and employee salary on a monthly basis is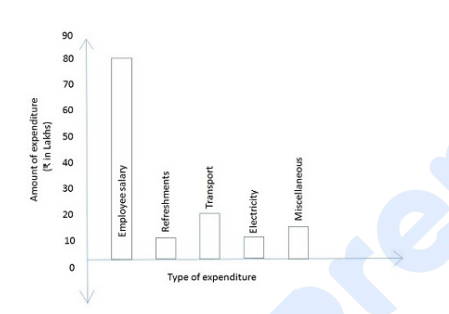
How many more people are involved in service than in trade?
The angle of elevation of the top of a tower from two horizontal points (in opposite sides) at distances of 25 meter and 64 meter from the base of tower are x and 90° - x respectively. The height of the tower will be?
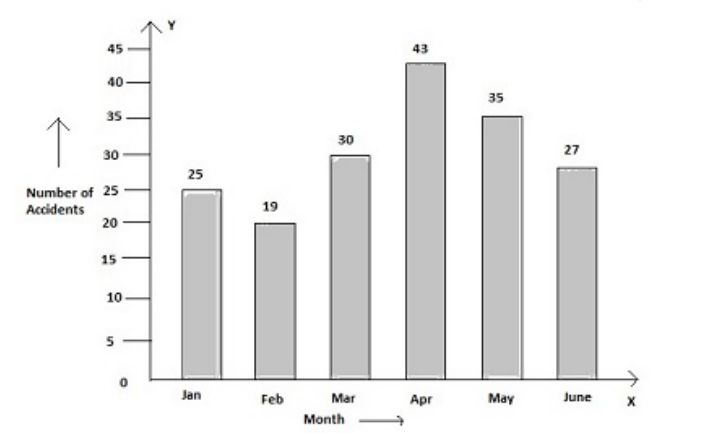
The bar-chart is showing the number of accidents in a city during the first six months of a year. Examine the bar chart and answer the following questions.
What is the % of accidents in the month of April to the total accidents in the city?
The bar-chart is showing the number of accidents in a city during the first six months of a year. Examine the bar chart and answer the following questions.
Compared to the month of January, what is the percentage of decrease in accidents in the month of February?
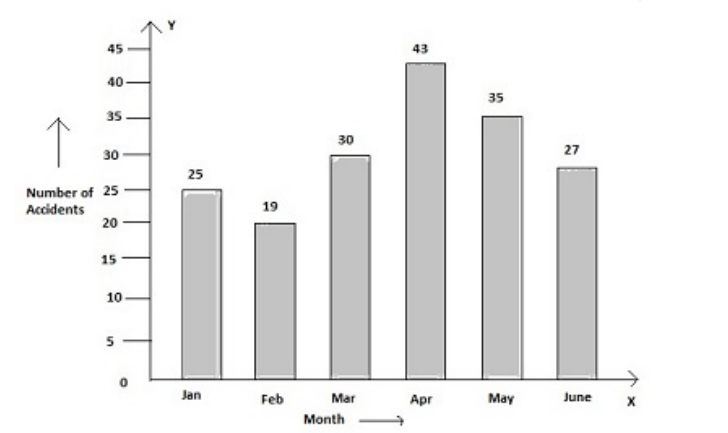
The bar-chart is showing the number of accidents in a city during the first six months of a year. Examine the bar chart and answer the following questions.
By what number, is the number of accidents that occurred in April greater than the average number of accidents that occurred during the 6 months period?
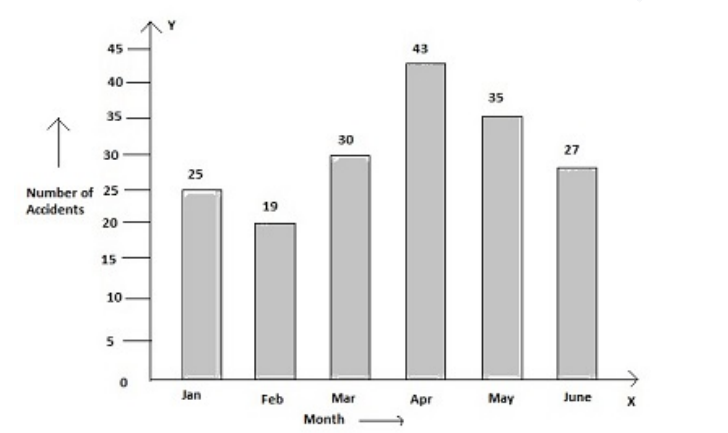
Important Questions from Mixed Data Interpretation
The following chart shows the number of telephone conversations at a Call Centre for various call durations on a particular day.

How many minutes of telephone conversations took place on that day?Study the given table answer the question that follows. The following table shows the income of a person (in thousand rupees) per annum over the given years.
Year School Salary Coaching Home Tuition 2018 132 42 12 2019 148 55 18 2020 166 68 24 2021 178 74 28 2022 196 88 35 What is the average income from school as a salary per year earned by the person over the given years?
The graph shows the monthly expenditure of a company (unit = 10 lakhs). Study the graph and answer the questions.
The percentage of money spent on miscellaneous isThe graph shows the monthly expenditure of a company (unit = 10 lakhs). Study the graph and answer the questions.
The fraction of money spent on refreshments isThe graph shows the monthly expenditure of a company (unit = 10 lakhs). Study the graph and answer the questions.
The total monthly expenditure of the company is